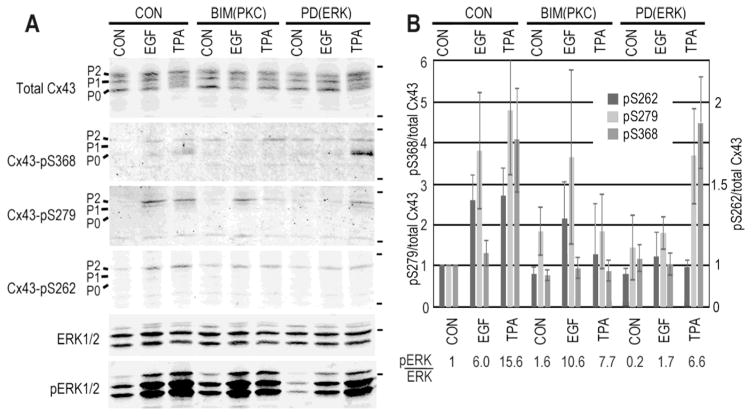
Figure 5.
Phosphorylation on S262 correlates with activation of ERK. NRK cells were treated with EGF and TPA for 30 minutes in the presence of the PKC inhibitor bisindomaleimide (BIM) or the ERK inhibitor PD98059 (PD) (Calbiochem). A. Cell lysates were analyzed by immunoblot with antibodies to S262, S279/282, S368 and ERK phosphorylated on Thr202/Tyr204 (Cell Signaling Technologies). The positions of the 50kDa and 36kDa (for the 4-Cx43 blots) are shown on the right. B. Graph shows quantification of Cx43 phosphorylation levels (n=3) and the ratio of pERK/total ERK is shown below. Note the scale on the left refers to S279/282 and S368 relative phosphorylation levels and the one on the right, which is non-linear, to S262. Linear regression analysis shows the phosphorylation on S262 is correlated to ERK phosphorylation with an R2=0.812.

