
Figure 3.
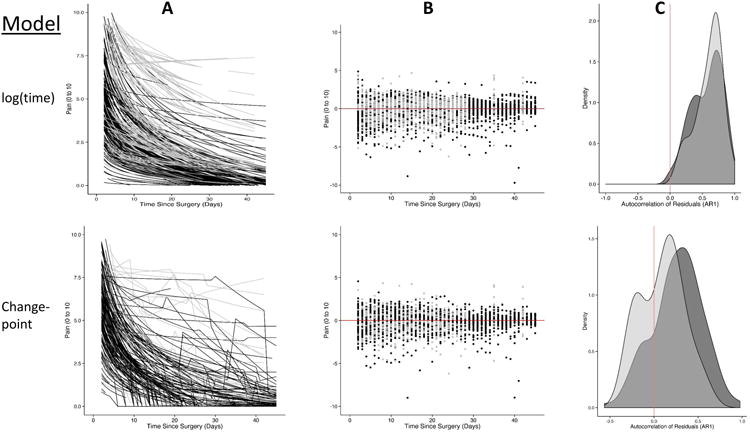
The modeled pain trajectories over time (A), the residuals (i.e., error) around these predictions (B) and the first-order autocorrelation of the residuals (i.e., how related errors are over subsequent time points) (C). The grey represents the total joint arthroplasty participants and the black the cesarean delivery participants. The top row represents the log(time) models that appear to represent the change in pain over time, but the use of a change-point model (bottom row) fit the data even better while reducing the correlation in the errors.