
Figure 6.
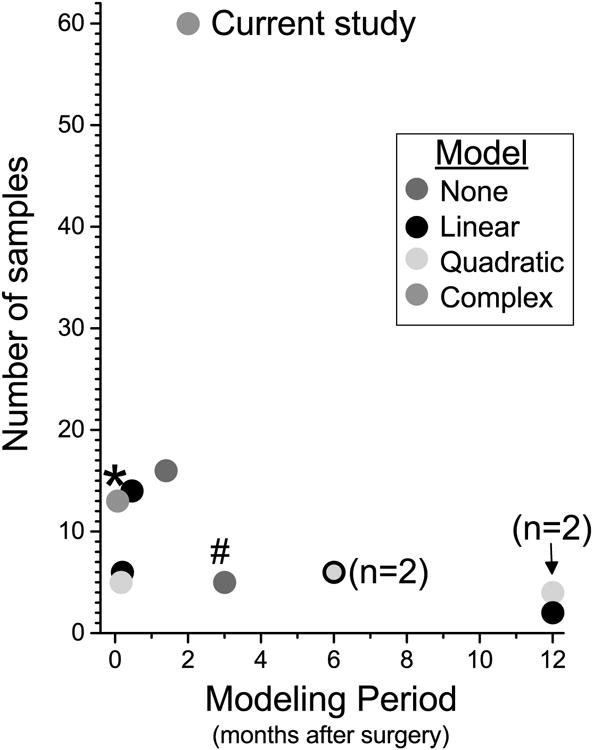
Summary of previous studies of recovery after surgery [1; 3; 4; 7; 11; 13-16] or with serial time sampling in medical patients [5; 10], showing number of samples obtained per patient and the modeling period. Each symbol represents a single study, unless otherwise noted, in when no formal model (red) or linear (black), quadratic (green), or complex (orange) models were fit to the data.