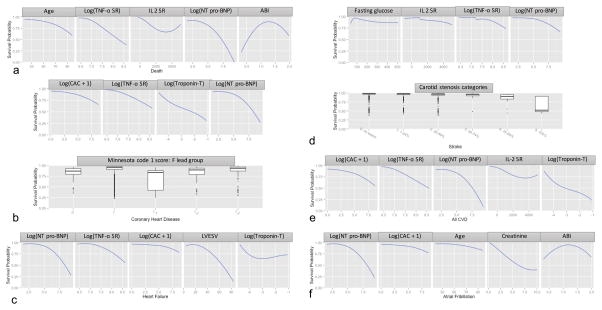
Figure 2. Plots showing Lowess curves (for continuous variables) and box plots (for categorical variables) of the survival probability vs variable values for the top-5 predictors for each of the outcomes at 12 years.
The y-axis represents survival probability calculated from the RF-20 algorithm (range: 0 to 1). The x-axis spans the range (or categories) of the variable of interest. Abbreviations: NT pro-BNP = N-terminal pro-Brain Natriuretic peptide, TNF-α SR = tissue necrosis factor- α soluble receptor, IL2 SR = interleukin-2 soluble receptor, CAC = coronary artery calcium score, LVESV = left ventricle end-systolic volume. Units for each variable: NT pro-BNP – pg/ml, TNF-α SR – pg/ml, IL2 SR – pg/ml, CAC – Agatston’s units, cardiac troponin T – ng/ml, ABI – ratio, age – years, fasting glucose – mg/dl.

