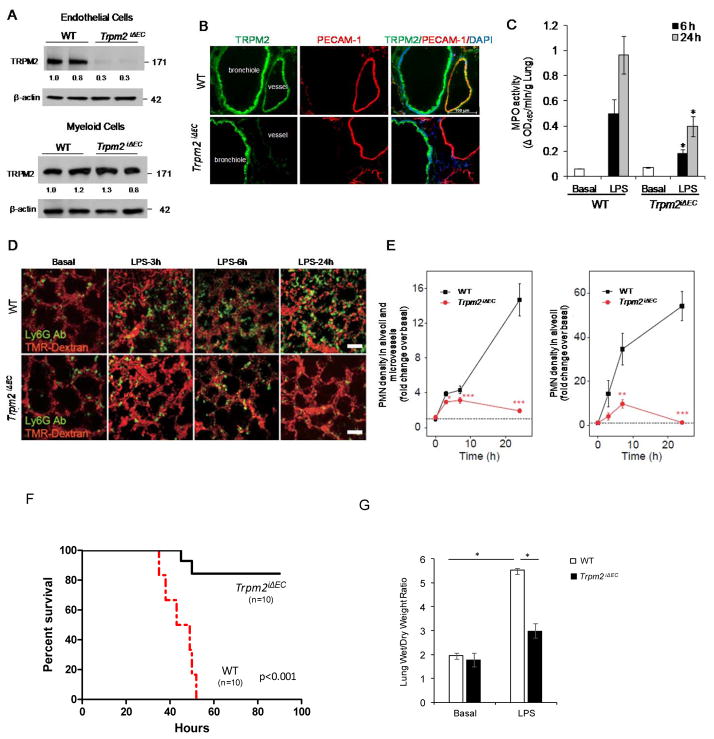
Figure 1. Conditional deletion of transient receptor potential melastatin-2 (TRPM2) in endothelial cells (Trpm2iΔEC) of mice prevents endotoxin induced PMN uptake, inflammatory lung injury, and mortality.
(A) Lung endothelial cells (ECs) isolated from Trpm2iΔEC mice and total cell lysates were used for immunoblot (IB) analysis of TRPM2 protein expression. (B) Lung tissue sections from WT (Trpm2+/+) and Trpm2iΔEC mice were immunostained with anti-TRPM2 and anti-CD31 antibodies and visualized by confocal microscopy. TRPM2 (Green), CD31 (Red), DAPI (Blue). Scale bar=100μm. TRPM2 is absent from the intima in Trpm2iΔEC mice. (C) WT and TrpmiΔEC mice were injected with i.p. endotoxin (LPS) or saline as above, lungs were collected at indicated time points, and used for measurement of MPO activity. n=5 mice per treatment. (D) in vivo imaging of PMNs and lung microvessels after LPS administration in wild-type and Trpm2iΔEC mice. Fluorescent-labeled LY6G antibody and TMR-Dextran were used to stain PMNs and lung microvascular structures, respectively. Colors are pseudocolors. Scale bar; 50 μm. (E) Quantitative analysis of PMN density in microvessels and alveoli (n=3–5 for each plot of wild-type, n=4–5 for each plot of Trpm2iΔEC). Fluorescent intensities of PMNs in field of view were quantified and value of no LPS condition in wild-type mice was normalized as 1 (Dotted line). * P < 0.05, *** P < 0.005 vs wild-type level. (E) Quantitative analysis of PMN density in alveoli (n=8–11 for each plot of wild-type, n=7–9 for each plot Trpm2iΔEC). Alveoli were outlined and fluorescent intensities of PMNs are quantified and the value of no LPS condition in wild-type mice was normalized as 1 (Dotted line). ** P < 0.01, *** P < 0.005 vs. wild-type level. (F) Age and weight-matched WT and Trpm2iΔEC mice were challenged with lethal dose of i.p. LPS (20 mg/kg, i.p.) and mortality was monitored for 96h. Trpm2iΔEC showed markedly increased survival compared with WT mice. n = 10 per group. *p<0.05. (G) WT and Trpm2iΔEC mice were challenged with PBS or 20 mg/kg LPS i.p. Wet and dry lung weights were recorded to determine edema. n = 6 /group. *p<0.05.

