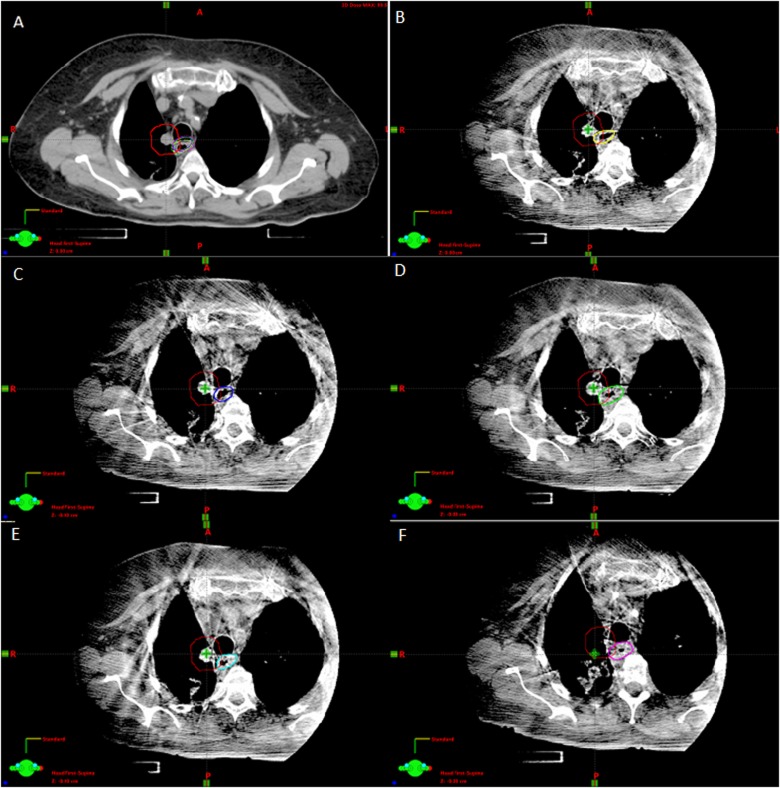
Figure 4.
A, Treatment planning computed tomography (CT) for patient 1 with the esophagus contours from daily cone beam CT (CBCTs) seen in B-F superimposed. Planning target volume (PTV) is outlined in red. The planned overlap between PTV and esophagus volumes was 0.34 cm3. Shifts in relationship between the esophagus and tumor were measured. B, CBCT #1 with esophagus contoured in yellow. Overlap between PTV and esophagus volume was 1.00 cm3. C, CBCT #2 with esophagus contoured in blue. Overlap between PTV and esophagus volume was 1.28 cm3. D, CBCT #3 with esophagus contoured in green. Overlap between PTV and esophagus volume was 1.55 cm3. E, CBCT #4 with esophagus contoured in cyan. Overlap between PTV and esophagus volume was 0.85 cm3. F, CBCT #5 with esophagus contoured in magenta. Overlap between PTV and esophagus volume was 1.24 cm3.

