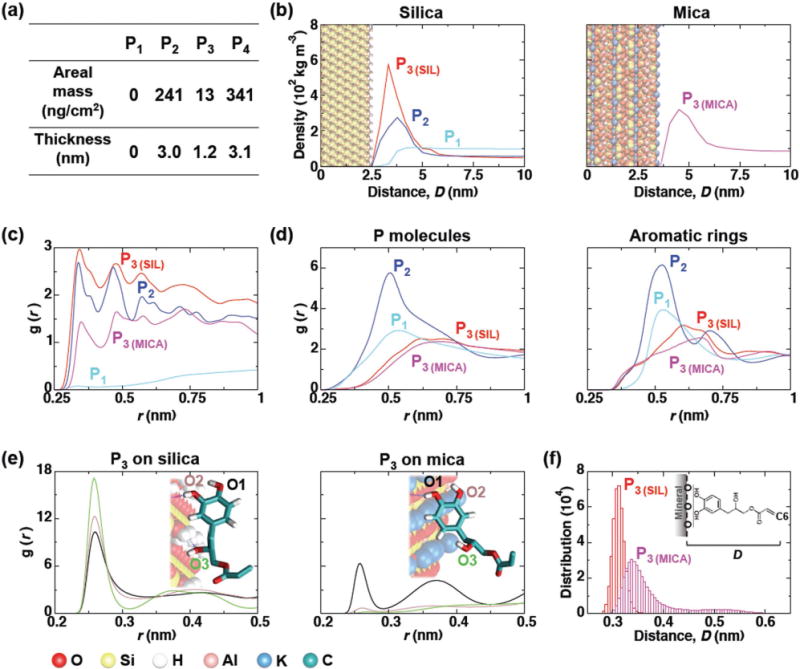
Figure 2.

Computational modeling of primer adsorption onto silica and mica surfaces. a) Calculated mass and thickness of adsorbed layers of P1–4 based on QCM-D results (see Supporting Information for more details). b) Density profiles of primers along the axis normal to the mineral surfaces. All three primers were simulated on the silica surfaces, and only P3 was simulated on mica to confirm the universal mineral adsorption. Curves represent the average densities as a function of distance D from the oxygen atoms on the mineral surface to each primer molecule. The position of the mineral (silica and mica) surfaces in the graphs are shown as CPK model (as illustrated in the bottom left of the figure). c) The time-averaged radial distribution functions between the aromatic rings for each primer type and the mineral surface oxygen atoms are shown. The radial distribution function is given by g(r) = 4πr2ρ dr, which represents a normalized histogram constructed from the calculated radial distances r between all molecular pairs of a given number density ρ. d) Radial distribution functions between the center of mass of primer molecules and aromatic groups (represented as carbon atoms) over time. e) Radial distribution function between the oxygen atoms from mineral surface and hydroxyl groups of P3. A representative snapshot of the preferred adsorption configuration is shown as an inset in each case each hydroxyl group labeled. f) Histogram of the average minimum distance between the plane formed by the O atoms of the mineral surface and the C6 carbon atom. All analyses were performed using the last 400 ns time interval of each simulation.
