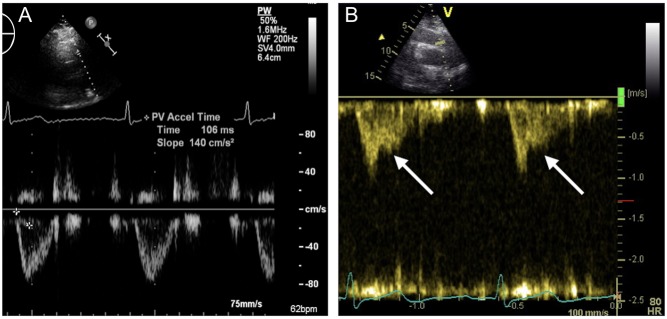
Figure 2.
Echocardiographic image of the right ventricular outflow tract with pulsed wave Doppler profile. In a normal subject (A) the signal is smooth and parabolic with a normal right ventricular outflow tract acceleration time. In acute pulmonary hypertension (B) a mid-systolic notching (arrows) with shortened right ventricular outflow tract acceleration time is evident.

 This work is licensed under a