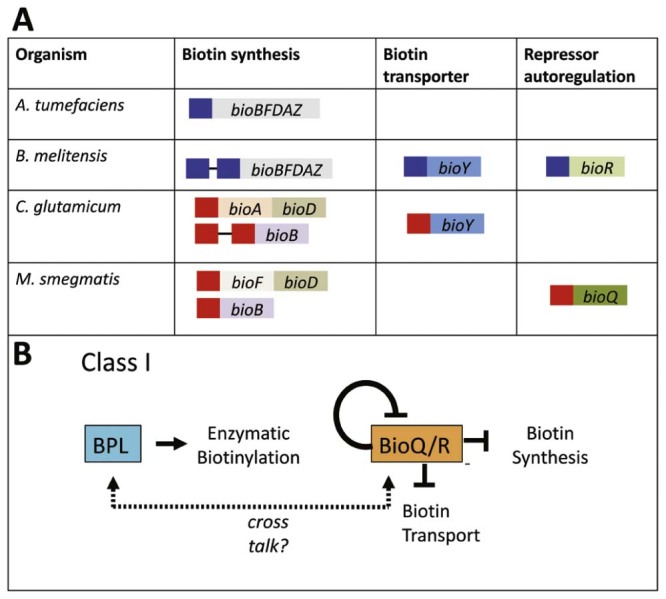
Fig. 5.

Summary of BioR and BioQ transcriptional regulation. (A) The genes and metabolic pathways regulated by BioR (blue boxes) and BioQ (red boxes) are shown. Each box represents an individual operator. (B) Schematic overview showing the two-protein model of protein biotinylation and transcriptional regulation in Class I BPLs.
