Fig. 5.
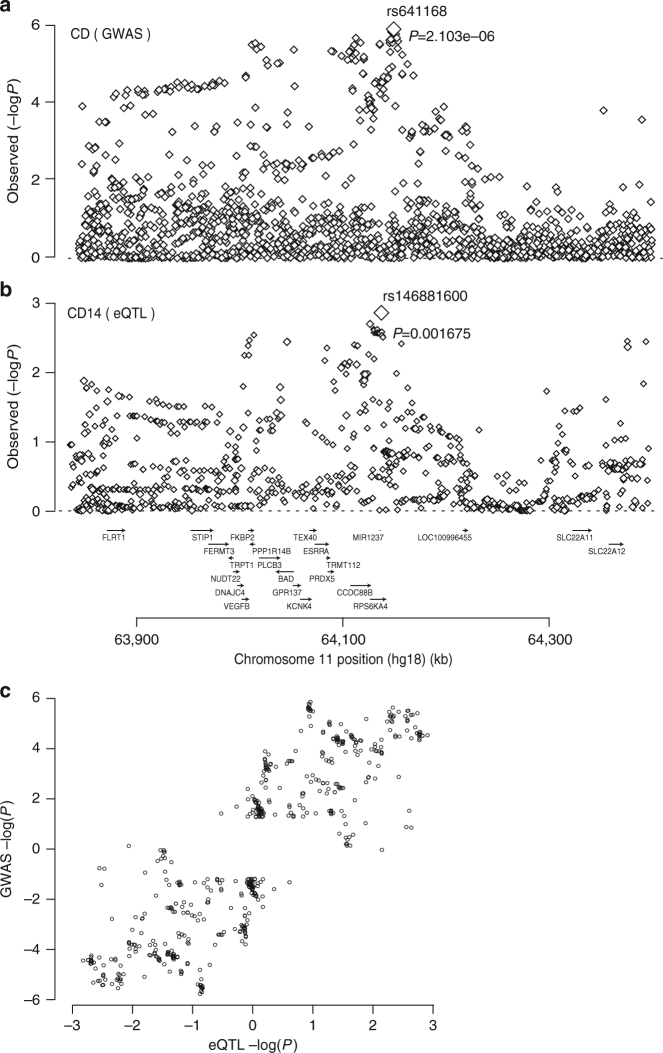
CD risk is positively associated with expression of CCDC88B in CD14+ cells. a Genetic association between CD and SNPs in a 600Kb window on 11q13. Log(1/p) values are given for all SNPs positioned on the human hg18 build1. The association signal was maximal for rs641168 (P = 2.1 × 10⁻⁶, using a logistic regression analysis). Gene names and positions are shown under the graph. b eQTL association pattern for CCDC88B expression in CD14+ cells for the same chromosome region as in a. The association signal was maximal for rs146881600 (P = 0.0017, using a logistic regression analysis). c Correlation between the disease and eQTL association patterns. Two data points are shown for each “informative” SNP (i.e., with data in both analyses and log(1/p) value ≥1.2 with either disease, eQTL or both). One corresponds to log(1/p) values (disease and eQTL) multiplied by the signs of the effects of allele 1, the other with the log(1/p) values multiplied by the signs of the effects of allele 2. The observed correlate was shown to be significant (P = 0.01, by a logistic regression analysis) using the approach described in the Methods section

