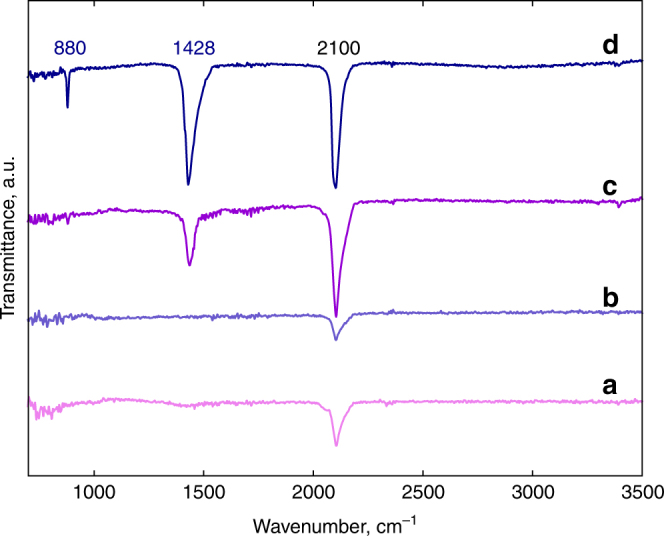
Fig. 2.

ATR-FTIR spectra of the samples before and after plasma reaction. Spectra a, c are taken from pure NaN3 without carbon nanotube support before and after plasma reaction, respectively; and spectra b, d are from plasma-reacted NaN3 deposited on short MWNTs before and after plasma reaction, respectively. The IR-active modes for NaN3 are the bending ν2 mode of the azide ion at 638 cm−1 (not shown here) and the anti-symmetric stretching ν3 mode of the azide ion at 2100 cm−1
