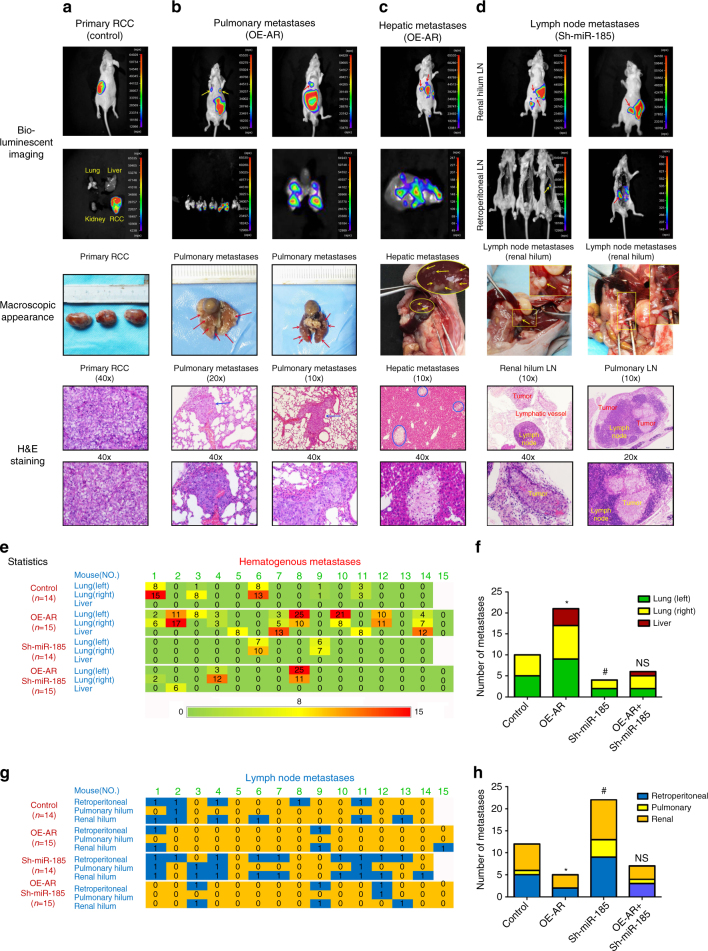
Fig. 7.
AR regulates differential metastasis in vivo via miR-185-5p. a–d The animals were killed 12 weeks later for primary RCC and metastases detection by ex vivo bioluminecent imaging (upper two panels), gross examination (middle panels), and histological staining with haematoxylin and eosin (H & E) (lower two panels). Scale bars in 10×, 20×, and 40× represent 200 μm, 100 μm, and 50 μm, respectively. a Primary RCC from control group. Tumor sizes were about 2 cm. b, c Representative photographs showed pulmonary and hepatic metastases from OE-AR group, macroscopically visible in lung or liver surface metastatic nodules (arrows or circles indicated) and microscopically visible nodules by H&E staining. d Representative photographs of lymph node metastases. Retroperitoneal lymph nodes after resection of all the abdominal organs (second panel), and pulmonary or renal hilum lymph nodes were gross examined by anatomical analysis (third panel) and confirmed by H&E staining (lower two panels). e Array diagram showed the hematogenous metastatic status of each mouse in various groups. Whether tumor metastasized or not referred to in/ex vivo bioluminescent or macroscopic imaging and confirmed by H&E staining. Number in each cell represents the visible surface metastatic nodules in left/right lung and liver. Green = no metastasis, red = > 15 nodules in two layers (with a distance of 3 mm) calculated into total numbers. f Quantitation (χ 2-test) of hematogenous metastases. Each group compared to control group. g Array diagram showed the lymphatic metastases of every mouse in various groups (0 = negative, 1 = positive). h Quantitation (χ 2-test) of lymphatic metastases *and # p < 0.05 were considered statistically significant. *AR compared to control and #Sh-miR-185-5p compared to control. NS no significance

