Fig. 2.
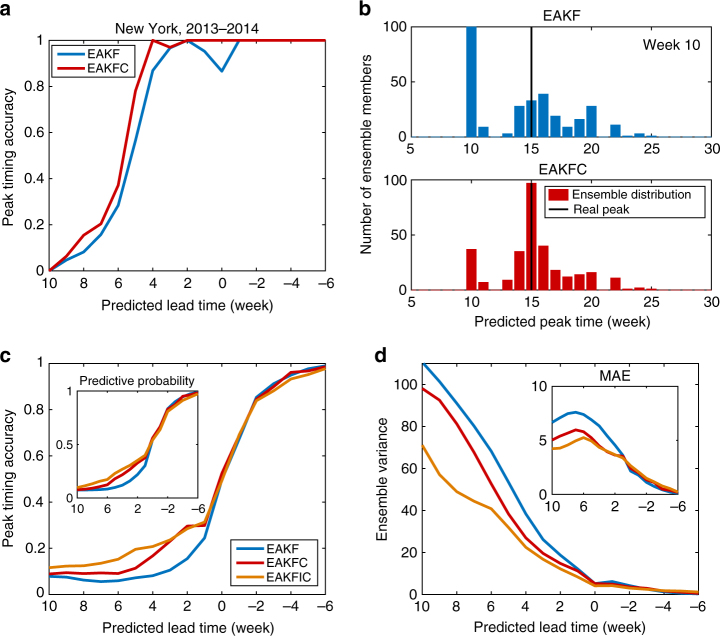
Comparison of peak timing forecast accuracy for historical influenza outbreaks. a Peak timing forecast accuracy for New York City during the 2013–2014 season. For each weekly observation, 100 independent 300-member ensemble predictions were generated. b The distribution of peak timing predictions of EAKF (upper panel) and EAKFC (lower panel) for the 2013–2014 season in New York City at 10 weeks after 1 October 2013. The vertical black solid lines indicate the real peak time (week 15). c, d Characteristics of ensemble predictions of peak timing for 95 cities in the United States for the 2003–2004 through 2013–2014 seasons, excluding the 2008–2009 and 2009–2010 pandemic seasons: the fraction of ensemble mean predictions accurate within ±1 week (c), within ensemble variance for those predictions (d), predictive probability of real peak time (±1 week) (inset of c), and MAE of ensemble mean predictions (inset of d). For each city and week, 100 predictions using the EAKF, EAKFC, and EAKFIC were independently generated. In c, d, a positive value of predicted lead means the peak is predicted to occur in the future, while a negative value implies the peak is predicted to have already passed

