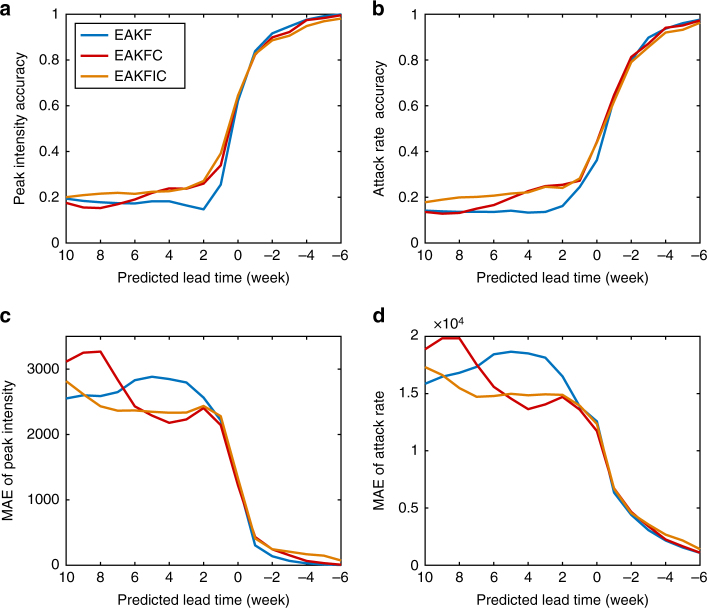
Fig. 3.
Prediction accuracy of peak intensity and attack rate. Results are averaged for 95 cities in the United States for the 2003–2004 through 2013–2014 seasons excluding the 2008–2009 and 2009–2010 pandemic seasons. For each city and season, 100 independent predictions with 300 ensemble members were generated weekly. a, b Percentage of ensemble predictions whose predicted values lie within the ±25% interval of observed peak intensity and attack rate. c, d MAE of ensemble predictions of peak intensity and attack rate. Predicted peak is defined as the peak magnitude of the ensemble mean trajectory

