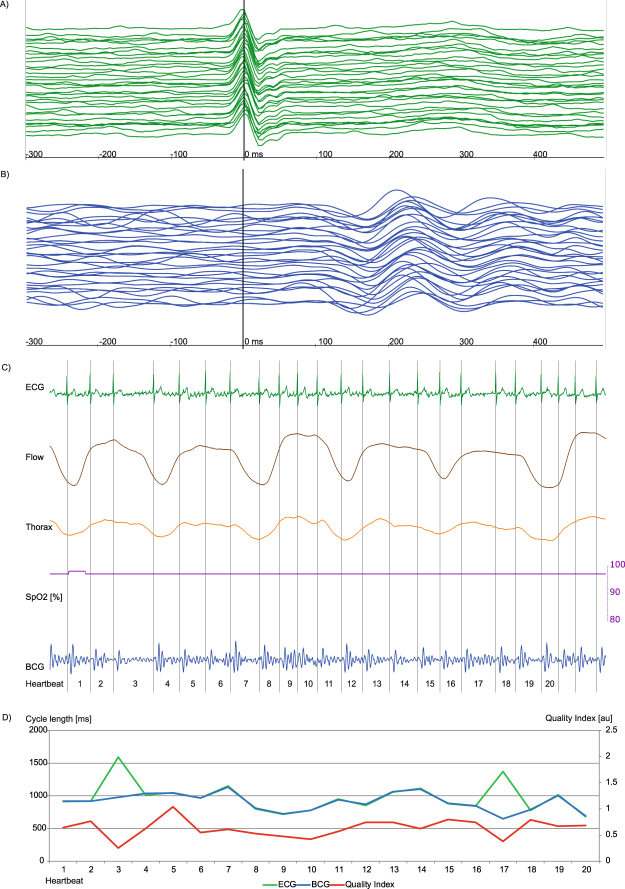
Figure 4.
Episode of AF with good signal correlation, for heartbeat 3 and 17 the BCG algorithm estimated a wrong cycle length due to a hampered signal indicated by a low QI (red line, Fig. 4d). Each signal is visualized by a unique colour: ECG (green), BCG (blue), Airflow (brown), thorax movement (orange), oxygen saturation (purple) and QI (red). (A,B) Plot of 23 consecutive heartbeats. The upper-most signal is the start, the bottom-most is the end of the sequence. The signals are synchronized and the maximum of R peak in ECG signal is situated at 0 ms. A: In the ECG signal, atrial fibrillation is shown. (B) Slightly differing height and chronological appearance of ventricular mechanical contraction in amplitude sequence can be seen. (C) The recorded signal during polysomnography is plotted. Flow and thoracic movement show normal movement and oxygen saturation is always in the upper 90%. A continuous measurement in BCG is possible, but the signal in the ECG indicates an absolute arrhythmia due to atrial fibrillation. (D) The diagram shows heartbeat cycle length of ECG and corresponding estimated BCG cycle length, as well as the calculated QI are shown. For the most time –during AF – ECG and estimated cycle length of the BCG signal correlate well with a near perfect overlap of the ECG (green) and BCG (blue) line. For heartbeat 3 and 17 the estimated cycle length by the BCG algorithm differs strongly from the ECG. For these cases, the QI decreases, indicated by a dip of the red line at these heartbeats. However, due to the flexible algorithm the following heartbeats are calculated correctly.

