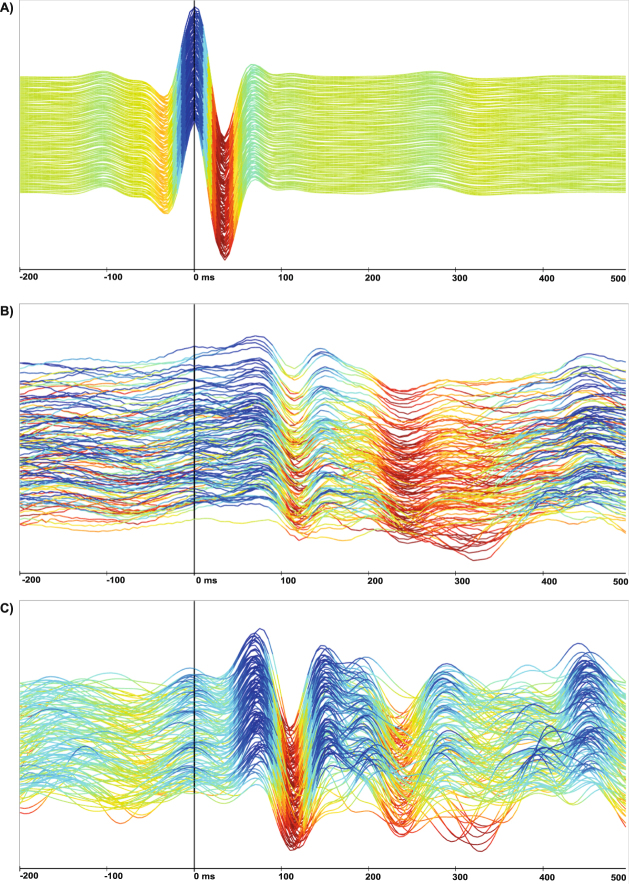
Figure 7.
Diagram of 128 consecutive heartbeats in ECG (A) and BCG (B,C) recording with time dependent analysis by ECG R-wave peak detection at 0 ms in any diagram. For better amplitude visualization, the maxima and minima are visualized with colour gradients in an arbitrary scale; (A) The ECG shows a harmonic signal over the whole displayed time during sinus rhythm; (B) Sinus rhythm; genuine BCG signal deteriorates due to signal superposition of breathing and movement artefacts. (C) Sinus rhythm (filtering the BCG signal) exposes a typical mechanical amplitudes sequence of each heartbeat but also shows the ambiguous and intraindividually variable nature of mechanical heartbeat movement.

