
Fig. 5.
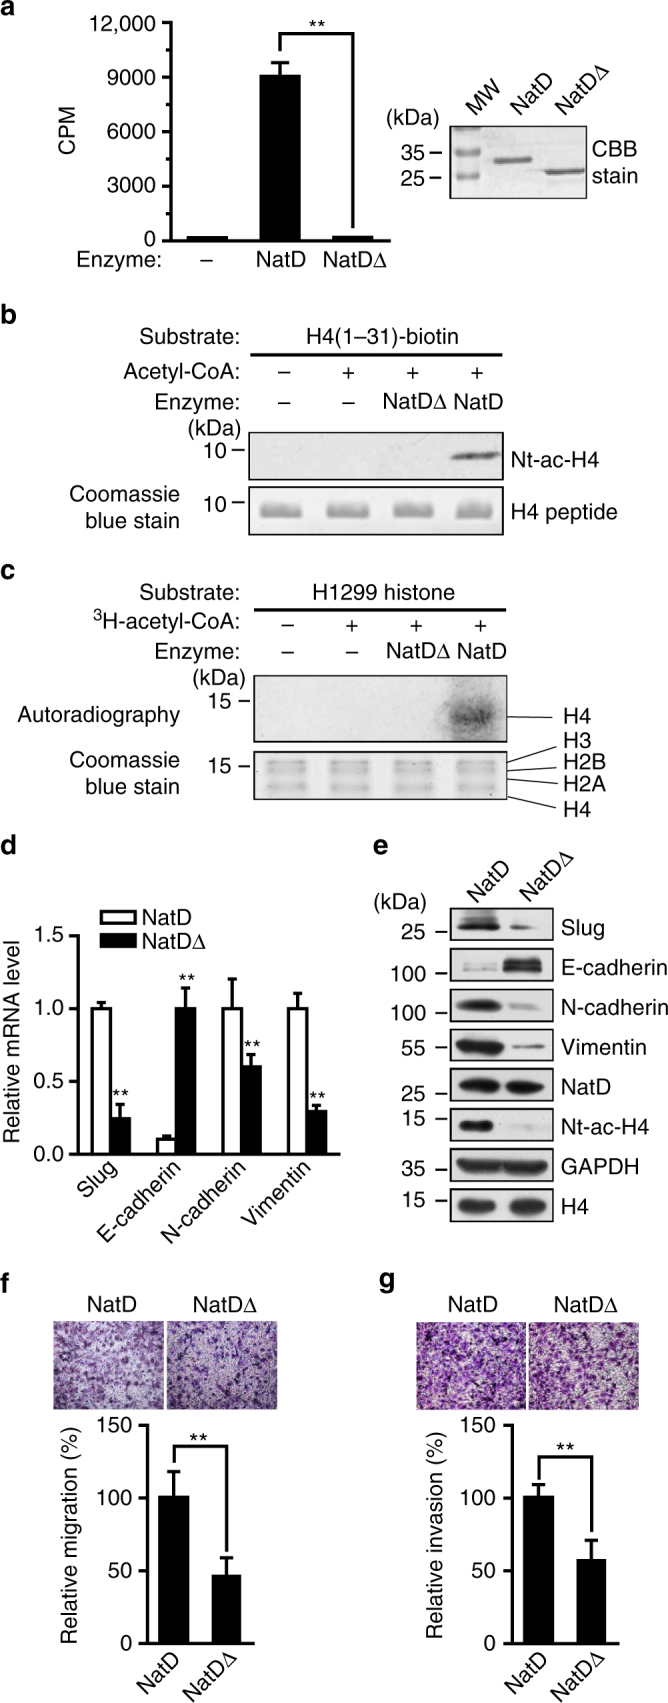
Regulation of Slug by NatD is acetyltransferase activity-dependent. a (left) In vitro acetylation assay showing the catalytic activity of NatDΔ and wild-type NatD (CPM, counts per minute). Data are mean ± s.d. of three independent experiments; Student’s t-test, **P < 0.01 compared with wild-type NatD. (right) SDS-PAGE analysis of purified recombinant NatDΔ and wild-type NatD proteins from E. coli stained by Coomassie brilliant blue (CBB). MW, protein molecular weight markers. b (top) Western blot analysis of an H4 (1–31) peptide from in vitro acetylation assay in the presence of NatDΔ or wild-type NatD. (bottom) H4 (1–31) peptide shown by Coomassie blue staining. Blots are representative of three independent experiments. c (top) Autoradiographic image showing products from in vitro acetylation assay using histones as substrates extracted from H1299 cells. Results are representative of three independent experiments. (bottom) Histones shown by Coomassie blue staining. d Quantitative real-time PCR analysis of mRNA levels of Slug, E-cadherin, N-cadherin, and Vimentin normalized to GAPDH in H1299 cells overexpressing NatDΔ or wild-type NatD. Data are mean ± s.d. of three independent experiments; Student’s t-test, **P < 0.01 compared with the wild-type NatD. e Western blot analysis of indicated proteins from H1299 cells overexpressing NatDΔ or wild-type NatD. GAPDH and histone H4 served as loading controls. Data are representative of three independent experiments. f, g Representative images of the migration (e) and invasion (f) of H1299 cells overexpressing NatDΔ or wild-type NatD with transwell assay from three independent experiments (top panel). Cell counts for the corresponding assays of at least four random microscope fields (×100 magnification). Cell migration and invasion are expressed as a percentage of control (bottom panel). Results are shown as mean ± s.d. from three independent experiments. Two-tailed Student’s t-test was used. **P < 0.01 compared with the indicated control