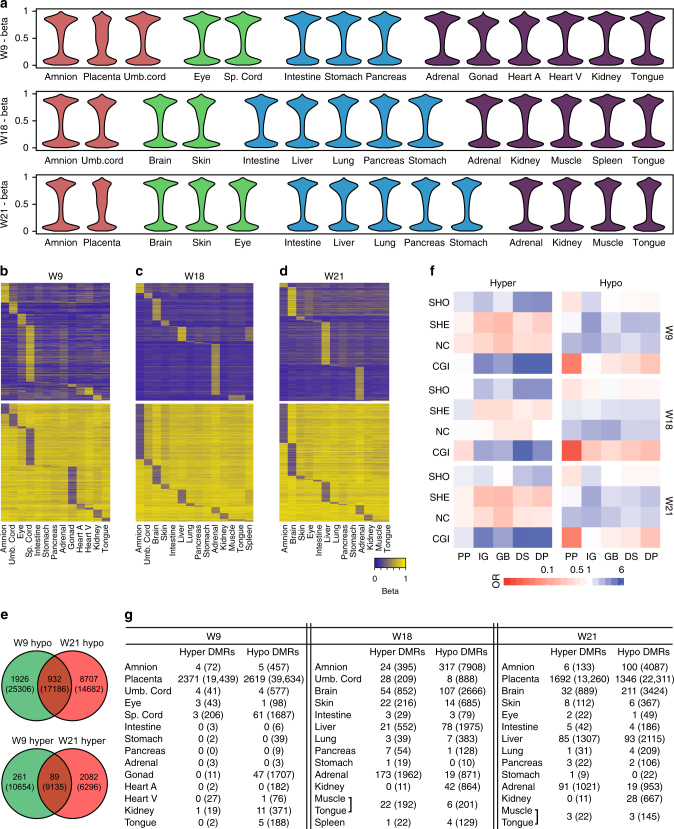
Fig. 3.
DNA methylation signatures of isogenic sets of organs. a Violin plots showing the distribution of the DNA methylation (beta values) in each of the 14 isogenic organs at W9, W18 and W21. Heart A, heart atrium; Heart V, heart ventricle; Sp. cord, spinal cord. b–d Heatmaps illustrating hyper- (top) and hypomethylated (bottom) CpGs per organ with a beta value difference of > 0.2 or < 0.2, respectively, at W9 b, W18 c and W21 d. Due to the quantity of hypermethylated and hypomethylated CpGs in the placenta at W9 and W18, those were removed but are given in Supplementary Fig. 3b, c. e Venn diagram illustrating the overlap of the hypermethylated (bottom) and hypomethylated (top) CpGs of the organs at W9 and W21. The numbers in brackets represent the CpGs including the placenta. The overlapping CpGs per organ are given in Supplementary Fig. 3d. f Genic and CGI-centric annotation of the identified hyper- (left) and hypomethylated (right) CpGs given as odds ratio (OR). CGI, CpG island; DP, distal promoter; GB, gene body; IG, intergenic; NC, non-CGI; PP, proximal promoter; SHE, shelf; SHO, shore. g Number of organ-specific hypermethylated and hypomethylated differentially methylated regions (DMRs) per isogenic organ. Tongue and muscle were pooled. For the nearest associated loci see Supplementary Data File 4.The number of organ-specific hypermethylated and hypomethylated individual CpGs are given in brackets

