Fig. 3.

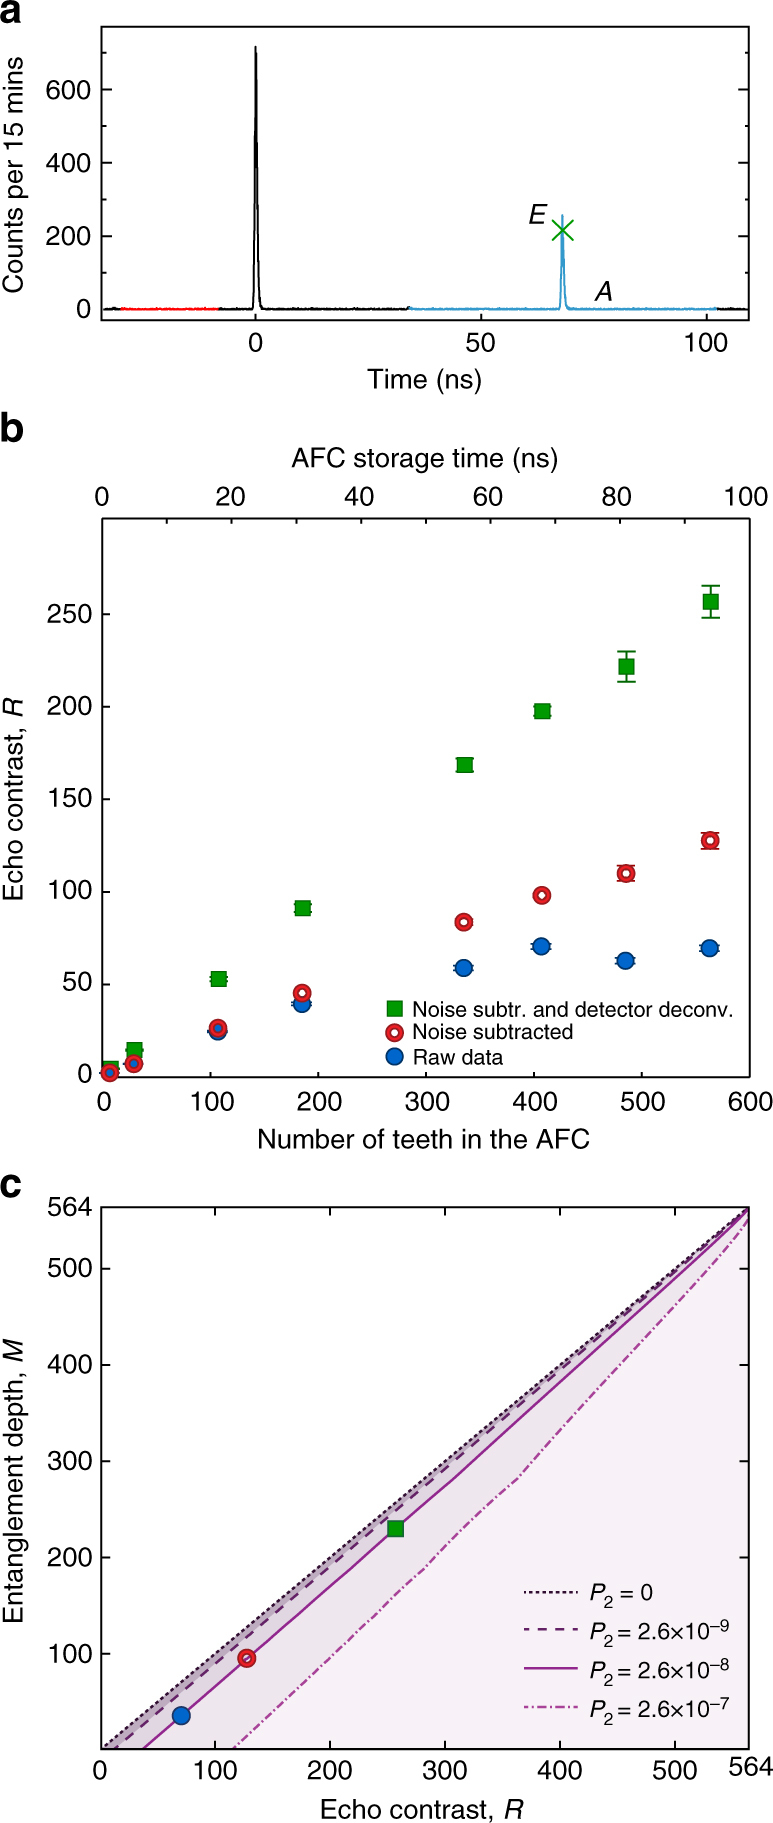
Measured echo contrast and bounds for entanglement depth. a An example of a time histogram for a storage time of 68 ns. The peak value of the echo (E), marked by the green x, is extracted from fitting the echo to a Gaussian profile, which reduces the impact of TDC sampling noise, and the blue region around the echo represents the time interval over which counts are averaged (A). The red region, which precedes both the transmitted and echo photon, is used to extract the background noise level. b Experimental values of echo contrast R as a function of the number of teeth N. Blue circles represent the values of R obtained from raw data, red open circles are obtained after noise subtraction, and green squares after noise subtraction and deconvolution of the detector response (see “Methods” section). Error bars indicate standard deviations derived from the Gaussian fitting and Poissonian statistics of the photon detection events. c Numerical bounds for the entanglement depth M as a function of echo contrast R for the experimental values P 1 = 3.5 × 10⁻³ for the single-excitation probability, N = 564 for the number of teeth, and P 2 = 2.6 × 10⁻⁸ for the double-excitation probability (solid line). For comparison, we also show the bounds for the same P 1 and N, but for P 2 = 0 (short-dashed line), P 2 = 2.6 × 10⁻⁹ (dashed line), and P 2 = 2 × 10⁻⁷ (dash-dotted line). The experimental values of the echo contrast R are shown as a blue dot (raw data), red dot (after noise subtraction), and green square (after noise subtraction and detector deconvolution) respectively
