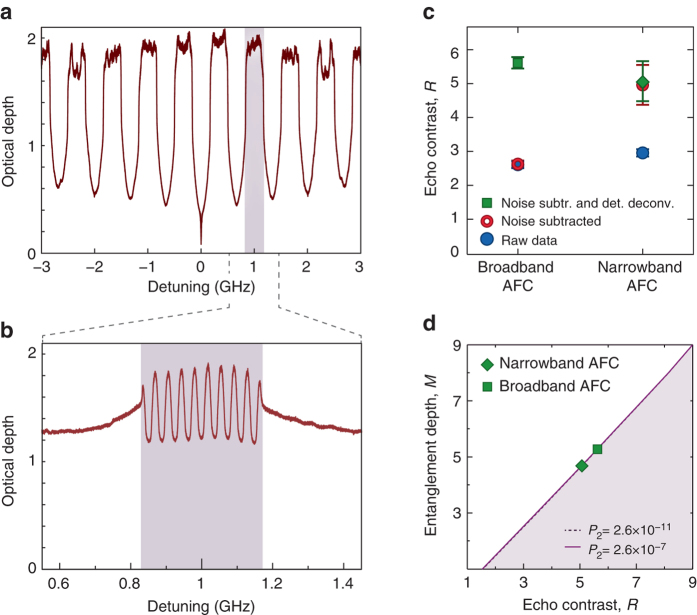
Fig. 4.
Entangled subsystems within each ensemble. a An AFC with a bandwidth of 6 GHz with N = 9 teeth, where each tooth is 0.33 GHz wide. b The plot shows an AFC with a narrower bandwidth of 0.33 GHz that is nested within a single tooth of the broadband AFC. This AFC is also created with N = 9 teeth. c Echo contrast for the broadband and narrowband AFCs. d Bounds on the entanglement depth as a function of echo contrast for the experimental values of P 1 = 1.1 × 10⁻² and P 2 = 2.4 × 10⁻⁷ for the broadband AFC with N = 9, and P 1 = 8.8 × 10⁻⁵ and P 2 = 1.6 × 10⁻¹¹ for the narrowband AFC with N = 9. It can be inferred from these two plots that the entanglement depth is at least 5 for the broadband and at least 4 for the narrowband AFC. Error bars in the last two plots indicate standard deviations derived from the Gaussian fitting and Poissonian statistics of the photon detection events

