Fig. 3.
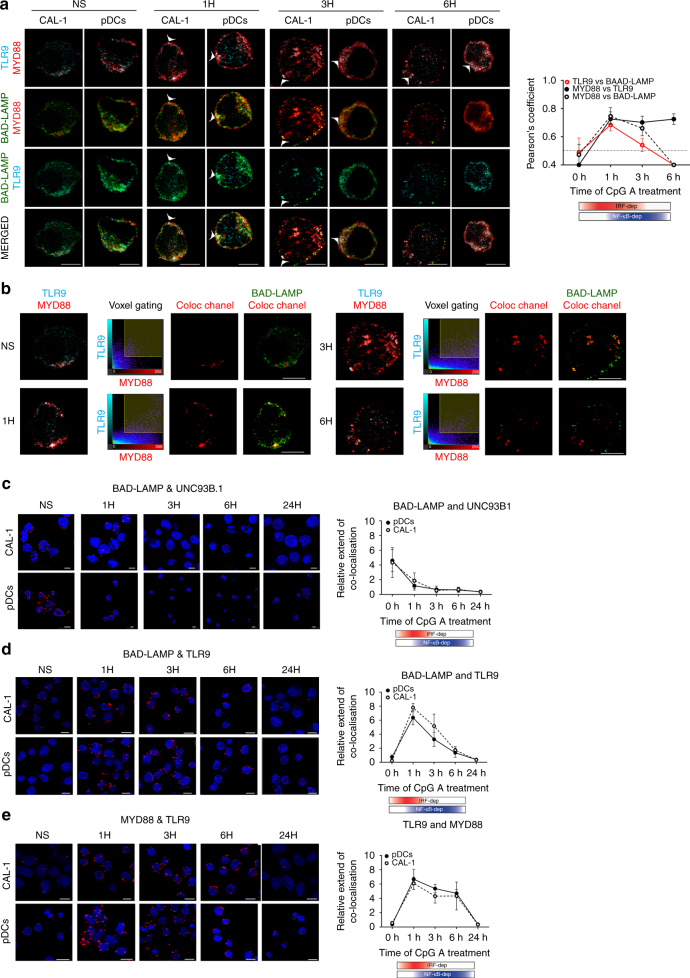
BAD-LAMP is co-localised with TLR9 and MYD88 upon activation by CpG. a (left) Immunofluorescence confocal microscopy (ICM) of CAL-1 and freshly isolated pDCs stimulated or not (NS) with CpG-A for indicated times was performed to visualise BAD-LAMP (green), MYD88 (red) and TLR9 (cyan). Arrowheads point at co-localisation area. (right) Co-localisation quantifications using Pearson’s coefficient measurement (ImageJ) are shown for TLR9 and BAD-LAMP (red line), MYD88 and TLR9 (black line), MYD88 and BAD-LAMP (dashed line) during time. Graphics represent Pearson’s coefficient means of 50 different cells ± s.d. for each time point from at least three independent experiments. b Voxel gating analysis of immunofluorescence confocal images of CAL-1 cells presented in a. Voxel gating was performed on TLR9 (cyan) and MYD88 (red) channels to generate a ‘coloc channel’ picture only showing co-localisation areas between the two proteins. This ‘coloc channel’ was then merged with single BAD-LAMP staining to obtain simplified tri-localisation images, revealing strong BAD-LAMP co-localisation with TLR9/MYD88 after 1 h of CpG-A exposure. Scale bars = 5 μM. c–e Immunofluorescence proximity ligation assay (iPLA) on CAL-1 or freshly isolated pDCs stimulated with CpG-A for indicated times performed for BAD-LAMP and UNC93B1 (c), BAD-LAMP and TLR9 (d), and TLR9 and MYD88 (e). (left) Confocal images are representative of at least three independent experiments in which the nucleus is stained by DAPI (blue) and proximity between the two proteins of interest is revealed by incorporation of labelled nucleotide (red) during the ligation reaction. Scale bars = 10 μM. (right) Quantification of iPLA for pDCs (black line) and CAL-1 (dashed line) by counting the number of red dots normalised to nucleus numbers using imageJ. Graphics are representing means of dots/cell for 150 different cells ± s.d. from at least three independent experiments. The bimodal regulation of TLR9 signalling is represented with a shading red rectangle for its IRF7-dependent phase and blue for its NF-κB-dependent phase

