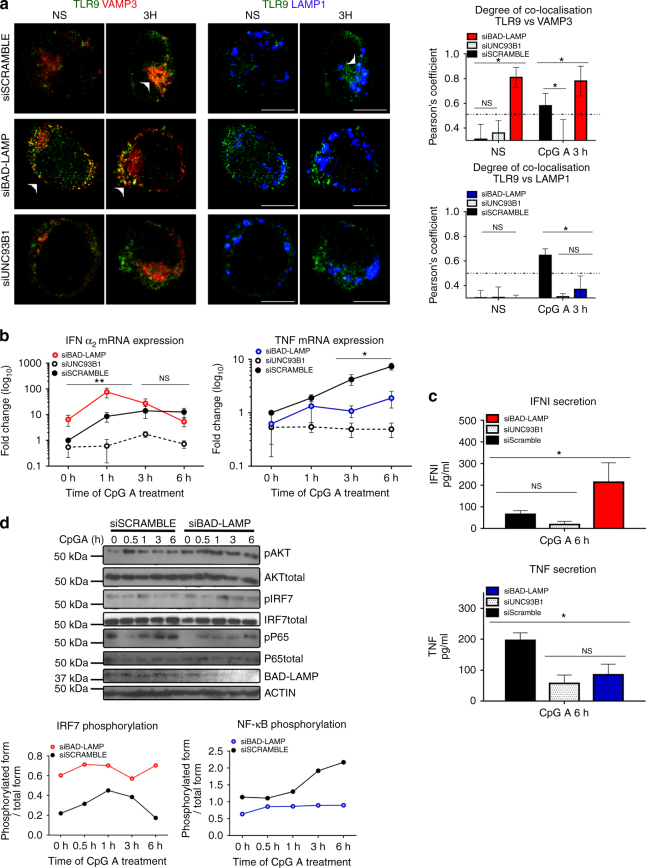
Fig. 6.
BAD-LAMP silencing promotes TLR9-dependent type-I IFN expression. a. (left) Immunofluorescence confocal microscopy (ICM) on CAL-1 electroporated with the different indicated siRNA and stimulated with CpG-A for indicated times. Analyse at steady state (NS) or 3 h after CpG-A stimulation of LAMP1, VAMP3 and TLR9 distribution. Images are representative of at least three independent experiments. Arrowheads indicate co-localisation areas. Scale bars = 5 μM. (right) Quantification of co-localisation between TLR9 with VAMP3 (top), or with LAMP1 (bottom) at steady state (NS) or 3 h after CpG-A stimulation, was performed by Pearson’s coefficient measurement using ImageJ. Graphic represent Pearson’s coefficient means of 50 different cells ± s.d. from at least three independent experiments. b IFNα2 (left) and TNF (right) mRNA level were monitored by RT-QPCR. Raw data have been normalised to housekeeping gene (GAPDH) and graphics represent fold change ± s.d. compared to non-stimulated cells from three independent experiments minimum. c IFNα (top) and TNF (bottom) secretion were monitored by ELISA at 6 h after CpG-A stimulation. Graphics represent cytokines concentration ± s.d. from three independent experiments minimum. d (left) CAL-1 cells electroporated with siRNA scramble or siRNA BAD-LAMP were treated with CpG-A for indicated times prior lysis and SDS PAGE treatment. Expression of BAD-LAMP, AKT, IRF7, p65 NF-κB subunit and their phosphorylated forms were detected by immunoblot. β-actin is shown as loading control. (right) Quantification of IRF7 (top) and p65 (bottom) phosphorylation levels normalised to their total form by ImageJ quantification. *P < 0.05 by unpaired student’s t-test

