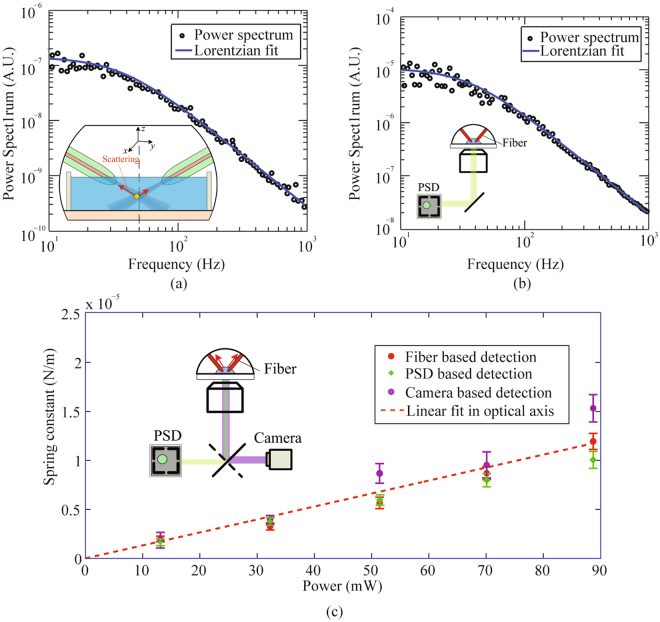
Figure 2.
Verification of the fiber based detection mechanism by the PSD based detection method, via power spectrum analysis, and the camera based detection method, via equipartition theorem. Typical experimentally measured power spectrum data of a 4.63 μm bead trapped in water (black circles) and Lorentzian fitting (solid curves) from the fiber based detection (a) and PSD based detection method (b) at 69.6 mW in the y axis. (c) Optical trapping spring constant as a function of optical power, based on the fiber based detection (red dots), PSD (green squares), and camera based detection method (purple circles). The linear fitted curve (red dashed line) to a set of optical spring constants from the fiber based detection passes through point (0, 0). The optical power shown is the power emitted by each fiber.

