Figure 3.

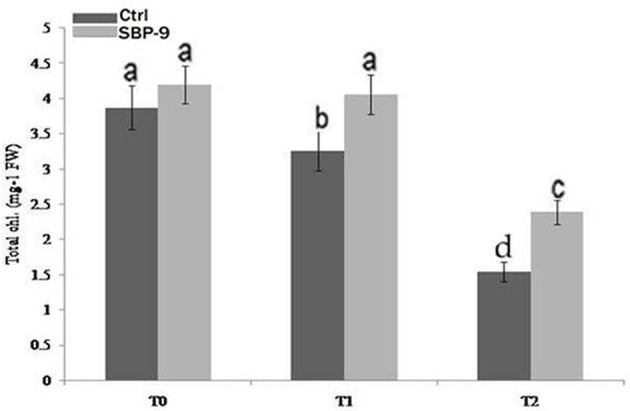
Effect of inoculation of isolate SBP-9 on total chlorophyll content under different treatments (T-0, T-1, T-2). Significant difference in each column has been shown by different letters.

Effect of inoculation of isolate SBP-9 on total chlorophyll content under different treatments (T-0, T-1, T-2). Significant difference in each column has been shown by different letters.