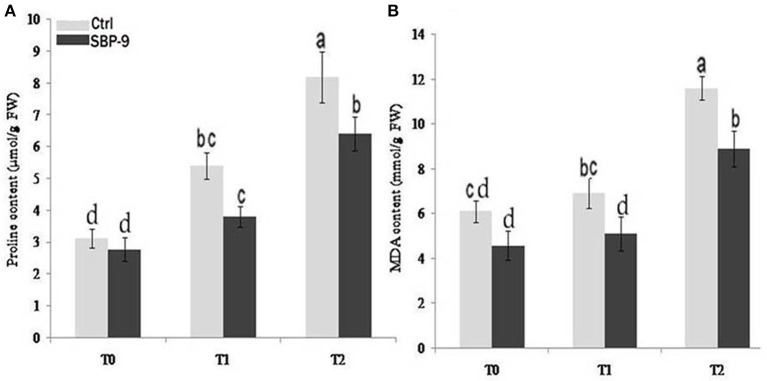
Figure 5.
Effect of SBP-9 inoculation on proline (A) and malondialdehyde content (B) under different treatments; T-0 (0 mM NaCl), T-1 (150 mM NaCl), T-2 (200 mM NaCl). Values are mean ± SD of triplicate sets of five measurements in triplicate sets (n = 15). Different letters on the bar in each column represent the significant difference.

