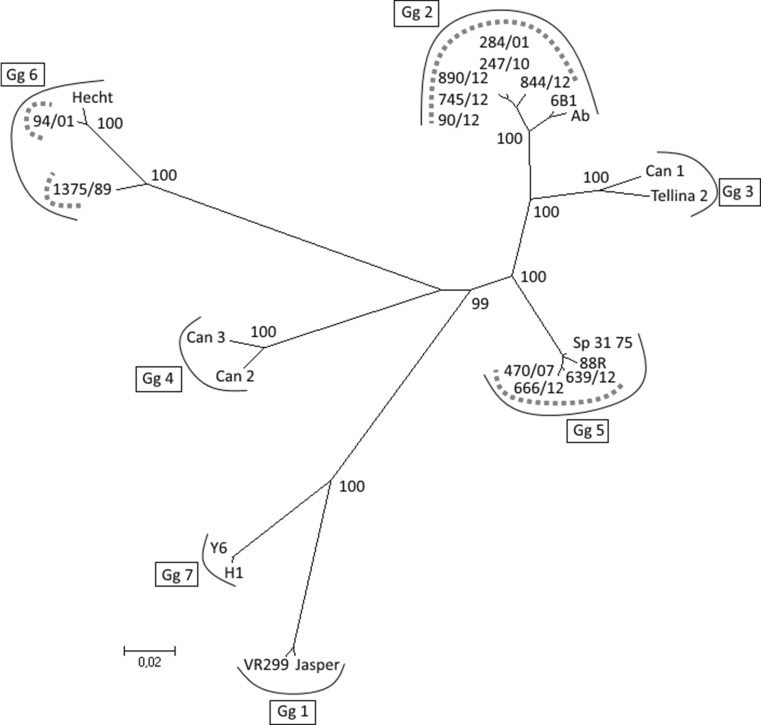
Fig. 4.
Maximum likelihood analysis based on IPNV polyprotein sequences. The Finnish isolates are marked with a dotted curved line, and genogroups (Gg) with a solid curved line. The scale bar indicates the number of substitutions per site. Numbers at the nodes of the tree indicate bootstrap values; values higher than 70 are given. The GenBank accession numbers of previously published sequences used in the analysis are presented in the “Materials and methods”

