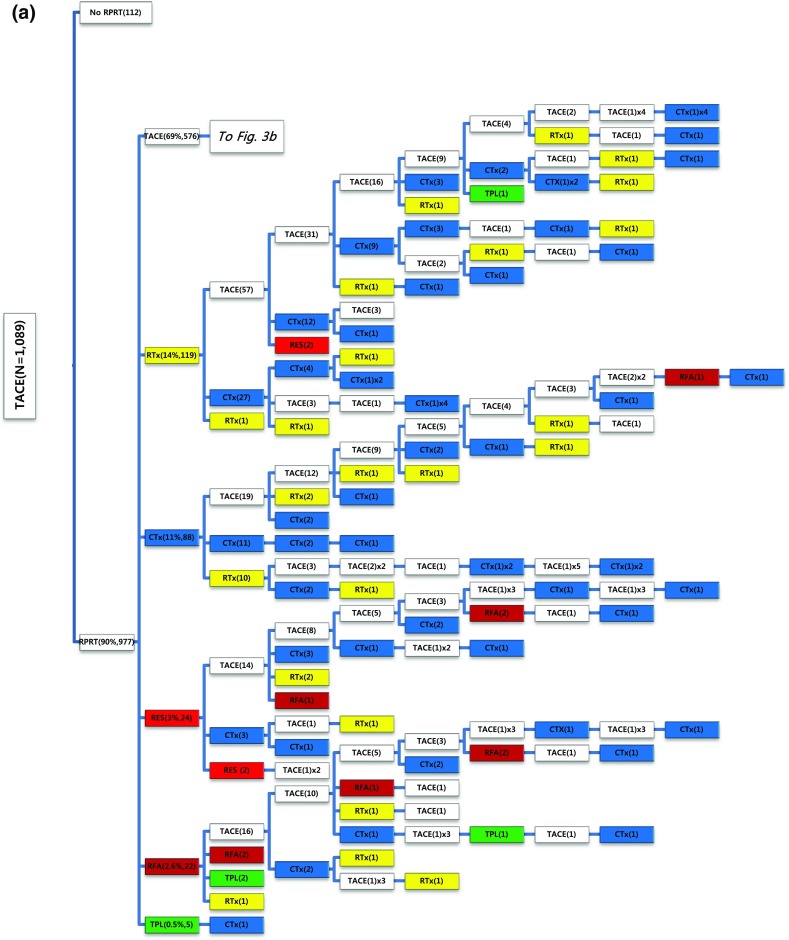
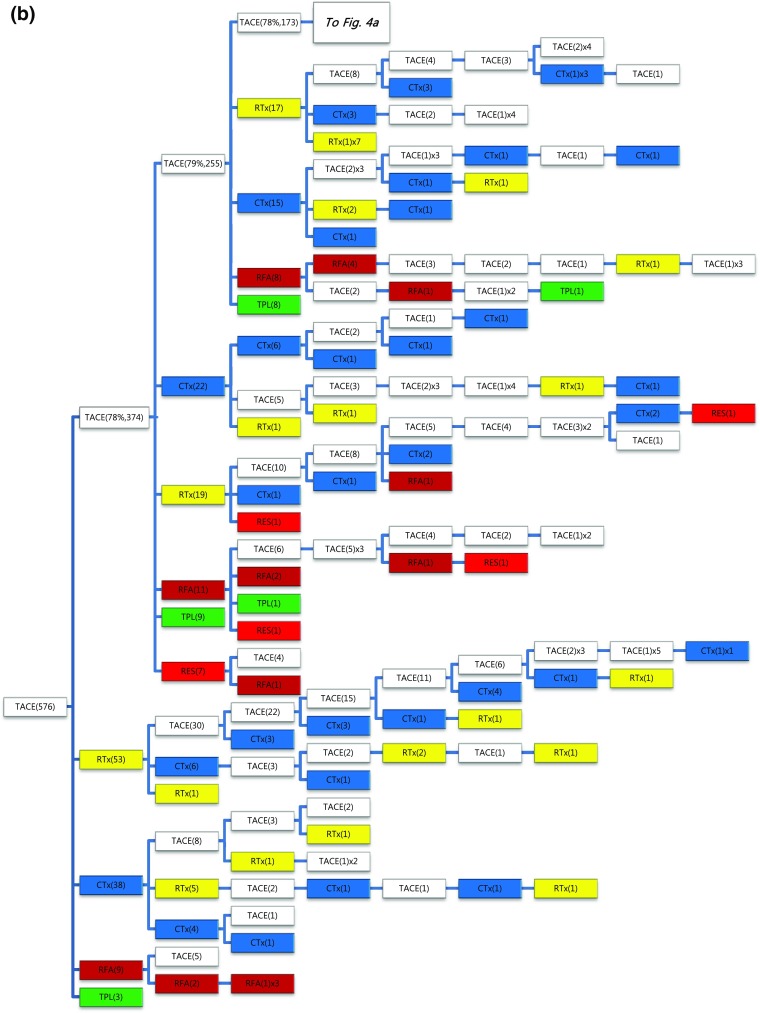
Fig. 3.


a, b Tree diagram showing treatment sequences following TACE as the initial treatment. Figures in parentheses indicate the number of cases. Treatment array is too long to be expressed in one figure; it is expressed as separate figures a, b. Each color (white, blue, green, yellow, red, and brown) represents a specific treatment modality. RES (red), resection; RFA (brown), radiofrequency ablation or percutaneous ethanol injection; RTx (yellow), EBRT; CTx (blue), systemic chemotherapy including sorafenib; TPL (green), transplantation; TACE (white), transarterial chemoembolization; RPRT, remaining, progressing, or recurrent tumor
