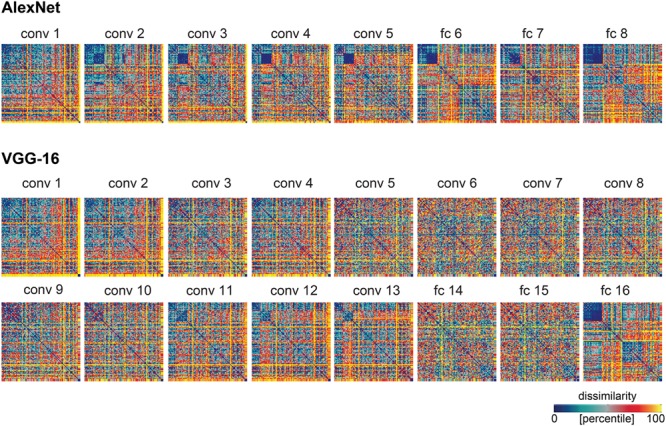
FIGURE 3.

Model predictions of the similarity judgments for each DNN layer. RDMs for each layer of each network, after weighting the feature maps (convolutional layers) or model units (fully-connected layers) within that layer to best predict the human similarity judgments. Values within each RDM were transformed into percentiles for visualization (see color bar).
