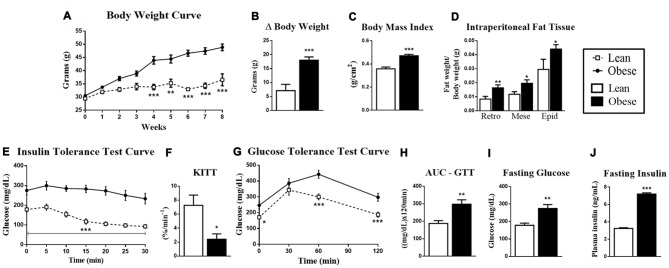
Figure 1.
Metabolic and physiological parameters of lean and obese animals. (A) Body mass curve during 8 weeks. (B) Δ Body mass between the first and eighth week of treatment. (C) Body mass index (BMI; g/cm2). (D) The retroperitoneal, mesenteric and epididymal fat mass weight/body weight. (E) Insulin Tolerance Test (ITT) curve. (F) ITT KITT curve. (G) Glucose Tolerance Test (GTT) curve. (H) Area under the curve (AUC) of the ITT. (I) Fasting glucose. (J) Fasting insulin. The bars and lines in the graphs represent the mean and standard error of the mean (SEM; n = 6–10). *p < 0.05 vs. Lean group. **p < 0.01 vs. Lean group. ***p < 0.001 vs. Lean group.

