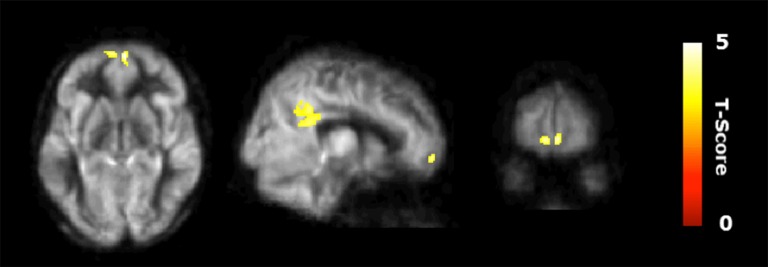
Figure 2.
Regional cerebral blood flow (CBF) results. Voxel-based analysis for the interaction contrast described in text, superimposed on an average CBF map of all participants. Both cluster volumes k = 3792 mm3 for posterior cingulate cortex (PCC) and k = 992 mm3 for medial orbitofrontal cortex (mOFC) are significant at an family-wise error correction (FWE) alpha level of 0.05 (k = 784 mm3).

