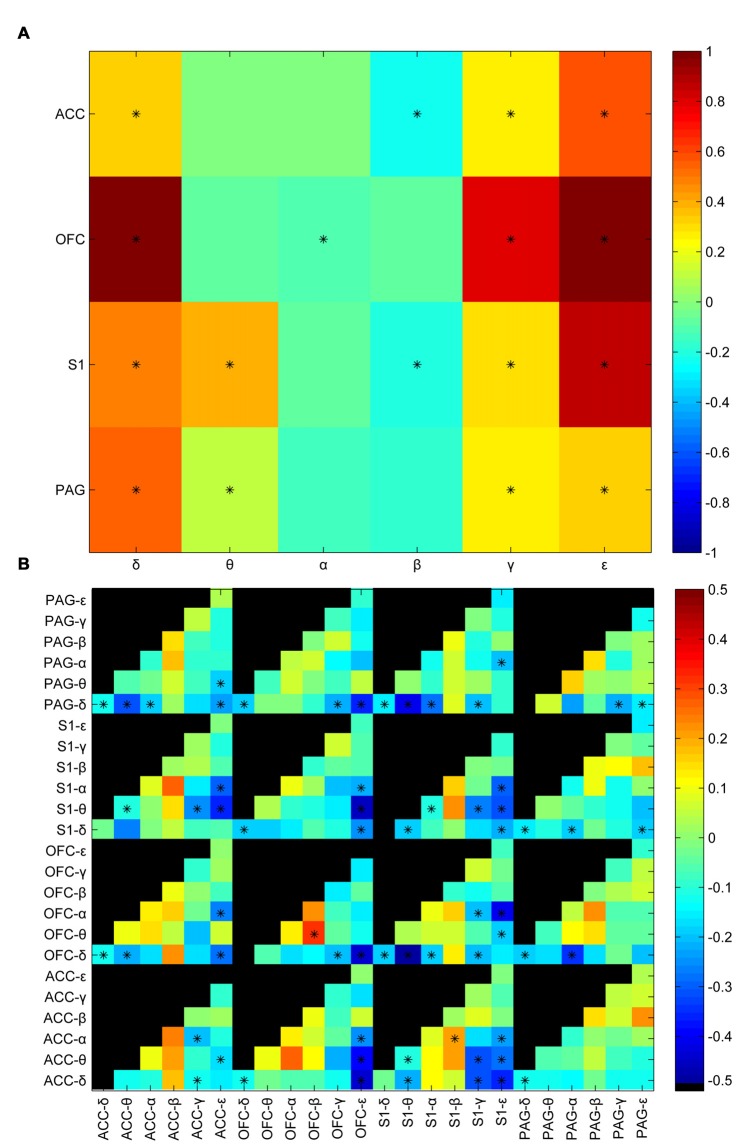
Figure 2.
Laser-induced oscillatory changes between noxious and innoxious groups. (A) Averaged power difference in the post stimulus time window within brain areas (anterior cingulate cortex (ACC), orbitofrontal cortex (OFC), primary somatosensory cortex (S1) or periaqueductal gray (PAG)) between noxious group and innoxious group. Different colors indicate the power difference (Blue to Red correspond to −0.5 to 0.5). Prominent power increase is observed in δ, γ and ε bands in all recorded areas. Power decreases in α and β bands in ACC, S1 and PAG. Asterisks indicate statistical significance (*p < 0.05, Holm-Bonferroni test). (B) Averaged difference of amplitude envelop correlation (AEC) in the post stimulus time window among different brain areas between noxious group and innoxious group. Normalized mean differences of AEC are indicated by different colors (Blue to Red correspond to −0.5 to 0.5, Black indicates no value for the corresponding combination). Asterisks indicate statistical significance (*p < 0.05, Holm-Bonferroni test).

