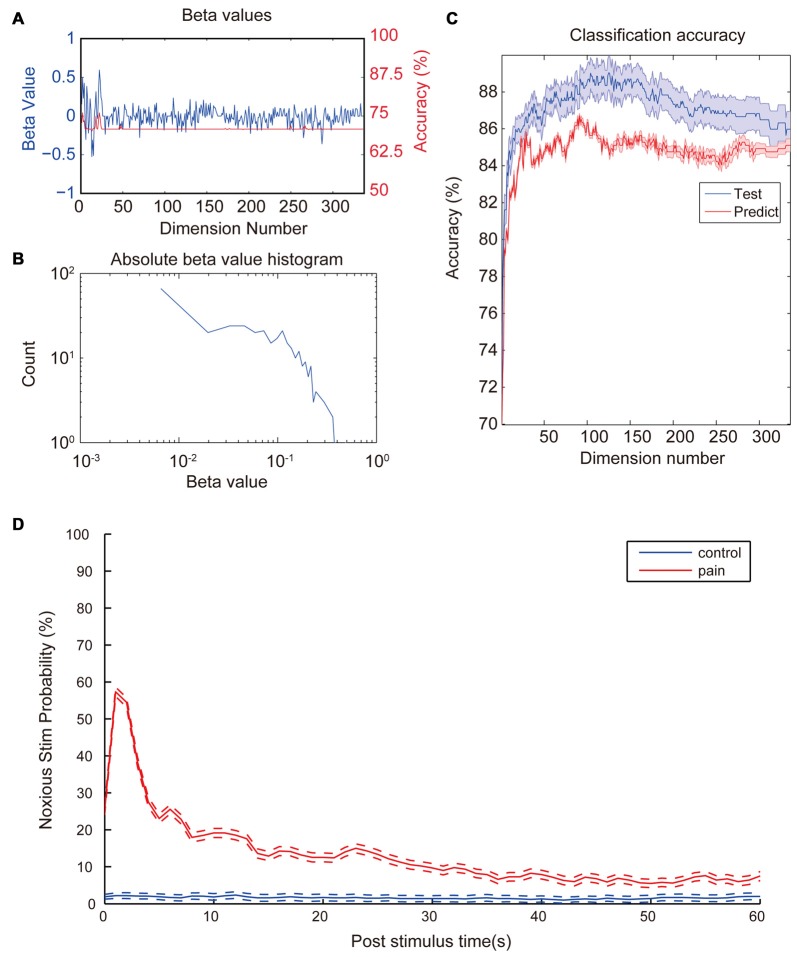
Figure 3.
Coefficient values and prediction rate of generalized linear models (GLMs). (A) β-values of the initial GLM classifier which trained with the whole dataset (Blue). Classification accuracy of GLMs trained with the corresponding LFP feature in the test set (Red). (B) Histogram of absolute β-values. Most features contribute little to the data classification. Only a few features contribute most to the classification. Distribution of coefficient values has a nearly log-normal distribution. (C) Prediction accuracy of the GLM models trained with different numbers of most contributing features. Training set (Blue) consists of 2962 laser trails from 12 rats and prediction set (Red) consists 296 trails from a separate animal. Accuracy was calculated based on a 10-fold cross-validation. Classification accuracy for the test set increases fast with input numbers of features at the beginning and slowly reaches a top accuracy with dimension numbers around 120. Then accuracy starts to drop slowly all the way to around 86%. Shaded area indicate standard error margin. (D) Averaged noxious laser stimulation probability vs. post-stimulus time. Rates were calculated from the most accurate GLM in the previous step. The blue line and the red line represent control stimulation and noxious stimulation, respectively. Dash lines indicate the standard error margin. Significant increase of pain prediction probability appears in a time window of 1 s to 2 s after noxious stimulation, indicating a robust feature of laser-induced pain. Control group kept a low value for the entire period and does not show any increase after the stimulation onset.

