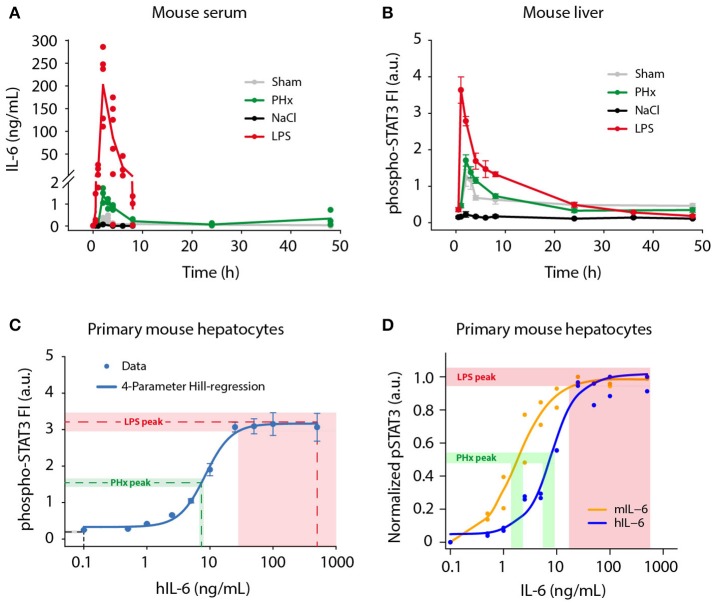
Figure 1.
Physiological IL-6 concentrations during liver regeneration and inflammation. Mice were subjected to control (Sham) surgery or partial hepatectomy (PHx), and control (NaCl) or lipopolysaccharide (LPS, 1 μg/g body weight) treatment. Serum and livers were collected at indicated time points. (A) Absolute serum IL-6 levels were measured by a bead-based immunoassay. Filled circles represent data from individual mice, solid lines connect average values of biological replicates. Sham, PHx, and LPS-treatment: n = 3–6 per time point; NaCl: n = 1 per time point. (B) STAT3 phosphorylation at Tyr-705 was quantified by multiplexed bead-based arrays in lysates of frozen mouse liver samples. Per time point or IL-6 dose, 3–6 biological replicates were measured and scaled by normalizing to their average signal. Filled circles represent average ±standard error of the mean (SEM) of biological replicates; solid lines are shown for visual guidance in the mouse liver data set. (C) Primary mouse hepatocytes were stimulated with 0.1–500 ng/mL of recombinant human IL-6, and lysed after 20 min. The 4-parameter Hill regression function (C) was generated using SigmaPlot software, and served to convert phospho-STAT3 signals to IL-6 concentrations. Dashed lines represent average phospho-STAT3 signals of the 1 and 2 h time points (NaCl, LPS), or 2 and 3 h time points (PHx), and corresponding derived IL-6 concentrations. Shaded areas represent standard error of the mean. (D) Primary mouse hepatocytes were stimulated with mouse IL-6 or human IL-6 to derive the doses of human IL-6 mimicking regenerative and inflammatory conditions, indicating that 1.8 ng of mouse IL-6 is equally potent to 7.5 ng of human IL-6 on mouse hepatocytes. FI, fluorescence intensity; a.u., arbitrary units.

