Figure 4.
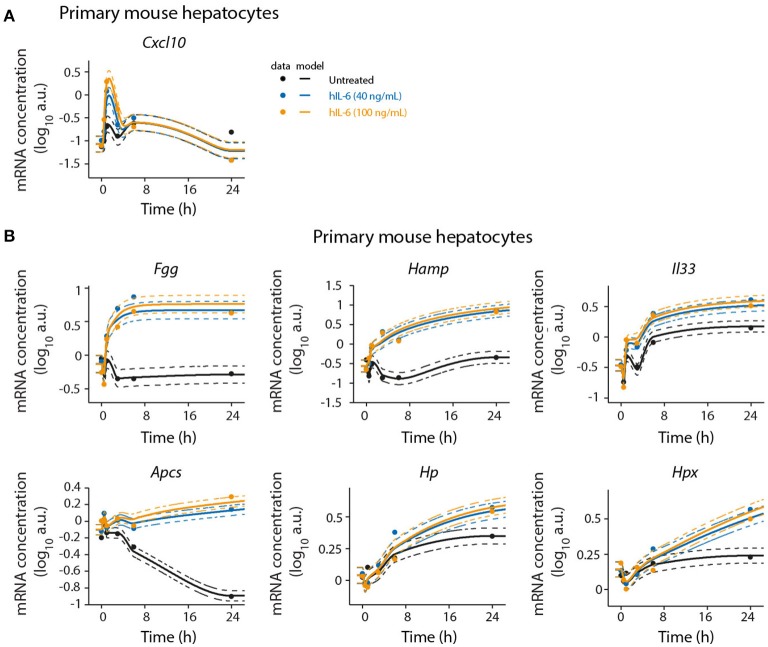
Detailed time-resolved analysis of selected IL-6 target genes. Primary mouse hepatocytes were stimulated with hIL-6 or left untreated and RNA was isolated at indicated time points. Target mRNA expression was analyzed by qRT-PCR (qPCR) (A Cxcl10; B Fgg, Hamp, Il33, Apcs, Hp, and Hpx). Data were normalized to the geometric mean (Vandesompele et al., 2002) of Hprt and Tbp expression. Filled circles represent individual replicates (n = 2); solid lines are model fits; dashed lines indicate errors estimated from the model. The expression level in the control is modeled using a monotonic spline. Additional replicate is displayed in Appendix Figure S10.

