Figure 7.
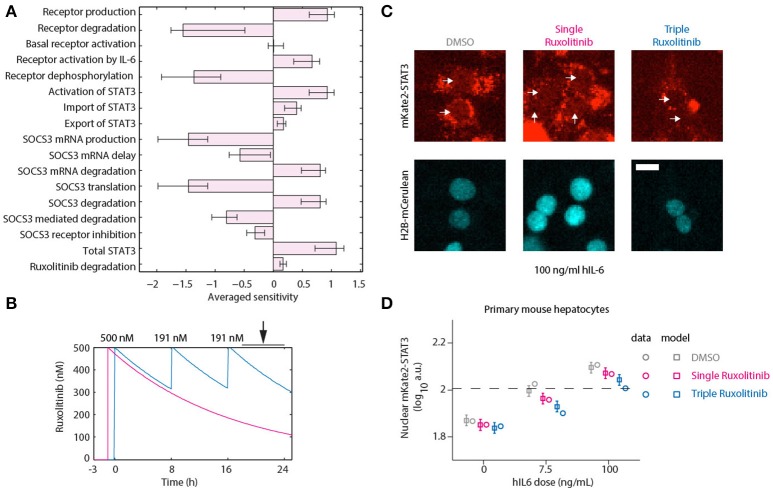
Optimized inhibition of STAT3 nuclear translocation. (A) Averaged Local Parameter Sensitivity Analysis for the integrated APP response. Bars indicate model sensitivities to a 50% perturbation in model parameter. Error bars indicate maximum and minimum sensitivity along parameter likelihood profiles. Large perturbations were performed since we are interested in parameters that would have a substantial impact on dynamics. (B) Model predictions for Ruxolitinib concentrations over time after single treatment with 500 nM at t = –1 h (Single), or using the optimized triple treatment scenario, including Ruxolitinib treatments at t = 0 h (500 nM), 8 h (191 nM), and 16 h (191 nM) (Triple). Arrow indicates the time window of nuclear STAT3 profiling. (C) Example widefield fluorescent microscopic images of primary hepatocytes from mKate2-STAT3 mice during the long-term quantification of IL-6-induced mKate2-STAT3 translocation in presence or absence of Ruxolitinib. Cells were stimulated with 100 ng/ml hIL-6 for 24 h, either treated with solvent control (DMSO), pre-treated for 1 h with 500 nM Ruxolitinib (Single Ruxolitinib) or co-treated with 500 nM Ruxolitinib and re-treated with 191 nM at 8 and 16 h (Triple Ruxolitinib). Inhibitor treatment was performed as suggested by the model (B). Image quantification of nuclear mKate2-STAT3 was conducted from 20 to 24 h after hIL-6 stimulation. White arrows indicate positions of nuclei. H2B-mCerulean was used to indicate the positions of nuclei. Scale bar: 20 μm. (D) Squares represent model predictions for nuclear STAT3 after treatment with the indicated hIL-6 concentrations in combination with DMSO control, single or triple Ruxolitinib treatment. For experimental validation, primary mouse hepatocytes from mKate2-STAT3 mice were treated accordingly with DMSO or Ruxolitinib and hIL-6. Circles represent average nuclear STAT3 measured with time-lapse microscopy 20–24 h after hIL-6 stimulation. Error bars indicate the measurement noise as estimated by the error model. a.u., arbitrary units. Data presented corresponds to the average of at least 45 imaging fields per condition. For additional replicates see Appendix Figure S6. For additional experimental data used for model validation see Appendix Figures S93–S98.

