Figure 8.
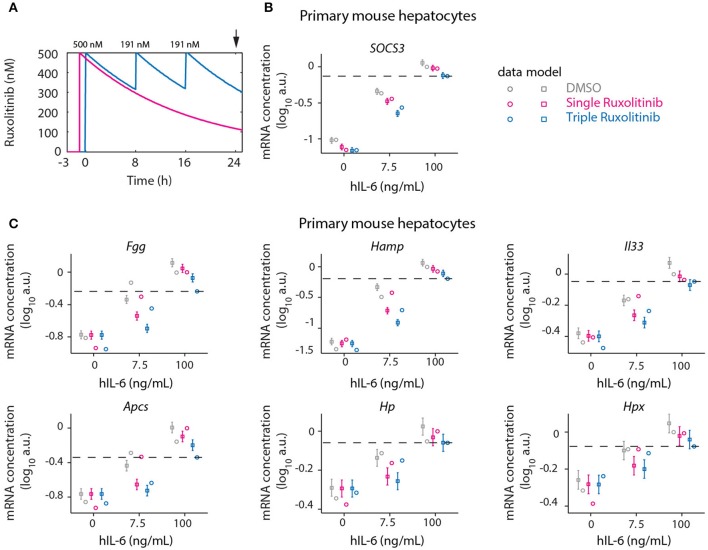
Optimized inhibition of APP gene expression in primary mouse hepatocytes. (A) Model predictions for Ruxolitinib concentrations over time after single treatment with 500 nM at t = –1 h (Single), or using the optimized triple treatment scenario, including Ruxolitinib treatments at t = 0 h (500 nM), 8 h (191 nM), and 16 h (191 nM) (Triple). Arrow indicates the time point of gene expression analysis. (B,C) Expression of Socs3 (B) and APP genes (C) at 24 h after inhibitor treatments as described in (A). Squares represent model predictions and circles represents experimental data, while error bars indicate the measurement noise estimated by the error model. a.u., arbitrary units. Dashed lines indicate the level of gene expression after triple inhibitor dosing of the cells treated with inflammatory dose of hIL-6 (100 ng/mL). Displayed are results of one biological replicate, while two more replicates are shown in Appendix Figure S7. For additional experimental data used for model validation see Appendix Figures S89–S91.

