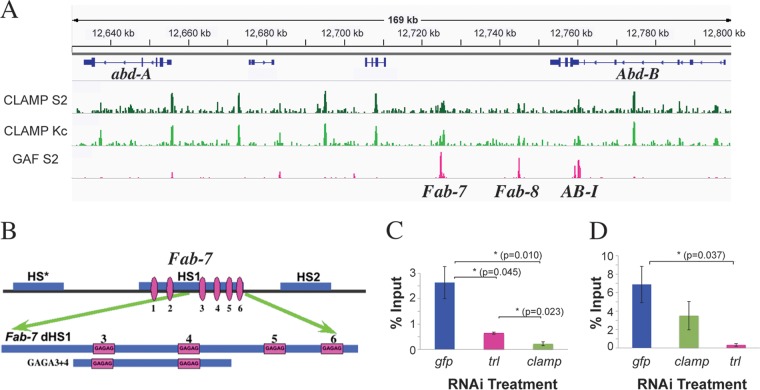
FIG 1.
CLAMP colocalizes with several boundaries in BX-C. (A) ChIP localization profiles for CLAMP in S2 and Kc cell lines (green) (31) and GAF (pink) (54) in a 160-kb region, including the Fab-7, Fab-8, and AB-I boundaries. (B) (Top) Chromatin organization of the Fab-7 boundary (1.2 kb) showing nuclease-hypersensitive regions. The distal 240 bp of Fab-7 HS1 (dHS1) contains 4 GAGAG motifs (pink). (Bottom) The 130-bp GAGA3+4 probe used for EMSA. (C and D) ChIP, followed by qPCR following clamp or trl knockdowns. The error bars represent standard errors obtained from 4 (gfp) or 3 (trl and clamp) independent experiments. P values from t tests are displayed for significance. *, P < 0.05, or **, P < 0.01 for differences between sample means. Comparisons between specific treatments are indicated by horizontal lines. For not statistically significant differences, P values are not displayed.

