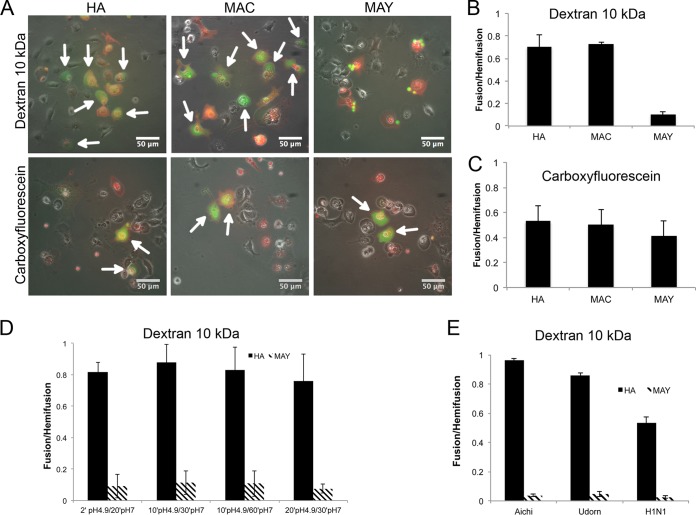
FIG 6.
Cell-RBC fusion assay monitoring lipid and content mixing upon fusion mediated by HA, MAC, or MAY. Cos7 cells were transfected 24 h prior to fusion with either HA, MAC, or MAY (Aichi [H3N2]), incubated with RBCs labeled with PKH26 lipid mixing indicator (red) and with either anionic FITC-dextran (10 kDa) or a carboxyfluorescein aqueous indicator (green). The fusion was triggered by exposure to citrate buffer with pH 4.9 for 2 min at 37°C, followed by 20 min at pH 7 prior to imaging and counting. (A) Set of representative fluorescent micrographs showing the fusion pairs of RBCs and transfected Cos7 cells. Hemifused cell-RBC pairs contain only red indicator. Fully fused cell-RBC pairs containing both red and green indicators are indicated by white arrows. MAY is not able to induce fusion pores supporting permeation of FITC–10-kDa dextran. Bar plots represent counted fusion events (green cells) containing either carboxyfluorescein (B) or FITC–10-kDa dextran (C) normalized to hemifusion events (red cells labeled with PKH26) driven by HA, MAC, and MAY. (D) The fusion was triggered by exposure to citrate buffer with pH 5 for between 2 and 20 min, followed by 20 to 60 min at pH 7 at 37°C prior to imaging and counting. (E) Bar plot of fusion events normalized to hemifusion events driven by HA and MAY from three different influenza virus strains, Aichi (H3N2), Udorn (H3N2), and WSN (H1N2).

