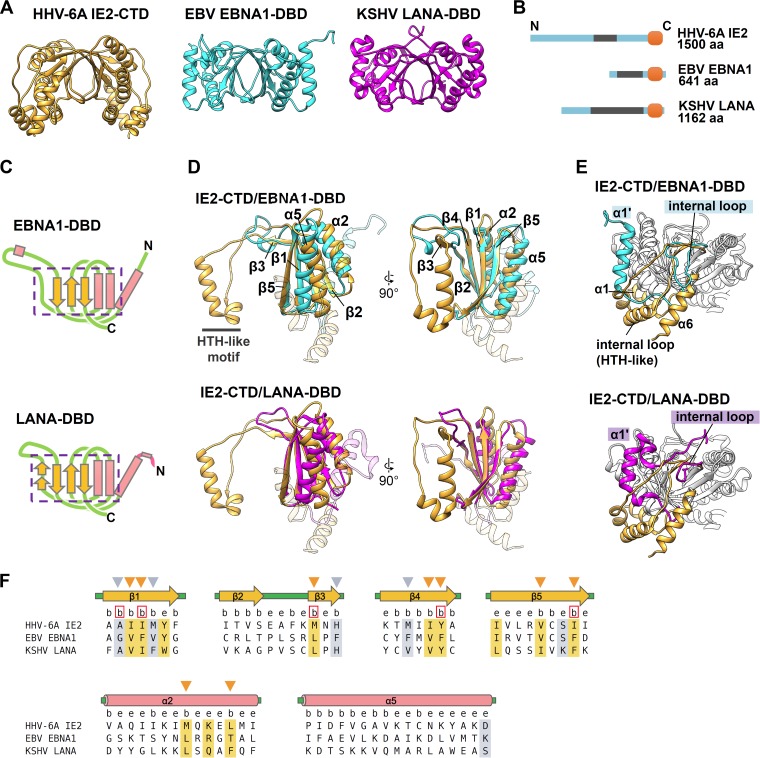
FIG 2.
IE2-CTD has a fold similar to those of EBNA1-DBD and LANA-DBD. (A) Ribbon models of IE2-CTD, EBNA1-DBD (PDB accession number 1VHI [32]), and LANA-DBD (PDB accession number 4K2J [33]), shown in orange, cyan, and magenta, respectively. (B) Comparison of the domain structures among IE2, EBNA1, and LANA. EBNA1 and LANA have a C-terminal domain corresponding to IE2-CTD at the C-terminal ends (orange) and repeat regions at the N-terminal sides (gray). (C) Topology diagrams of EBNA1-DBD and LANA-DBD showing the secondary structure arrangement. The pink rectangles and yellow arrows represent α-helices and β-strands, as described in the legend of Fig. 1B. The regions in EBNA1-DBD and LANA-DBD comparable to α1β1α2β2β3β4α5β5 of IE2-CTD are indicated by purple boxes with dashed lines. (D) The two-layered α/β sandwich folds of IE2-CTD (orange) and EBNA1-DBD (cyan) or LANA-DBD (magenta) superposed to show similarity. For clarity, the unique IE2-CTD α1 and α6 regions and the corresponding regions in EBNA1-DBD and LANA-DBD are shown as transparent ribbons. (E) The three structure elements of IE2-CTD, α1, α6, and the internal loop, constitute a unique structure showing differences from EBNA1-DBD and LANA-DBD. The α-helices corresponding to IE2-CTD α1 are labeled α1′ for EBNA1-DBD and LANA-DBD. (F) Structure-based sequence alignment of IE2-CTD, EBNA1-DBD, and LANA-DBD. Secondary structure elements determined for IE2-CTD (Fig. 1A) are shown at the top. Just below, positions where at least 5% of the surface area is accessible to the solvent and considered exposed are designated by the letter e, while buried positions are labeled b. The positions occupied by strongly or weakly similar residues are highlighted by orange and gray, respectively. The conserved and buried residues, which are likely important for protein folding, are indicated by arrowheads above the sequence, and the positions where the side chains face the dimer interface are shown as red boxes.

