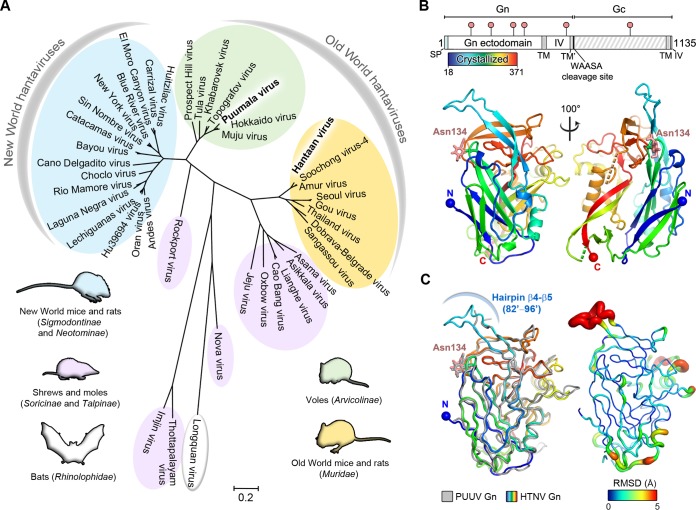
FIG 1.
Phylogeny and crystal structure of HTNV Gn ectodomain. (A) A maximum-likelihood phylogeny of 42 hantaviral Gn glycoprotein sequences separates hantavirus species according to host reservoir. The three clades of hantaviruses borne by rodents are annotated in yellow, green, and blue. Hantaviruses carried by shrews and moles are annotated in purple, and Longquan virus, isolated from bats, is annotated in white. The scale bar indicates amino acid substitutions per site. (B) The organization of the HTNV glycoprotein precursor (above) and crystal structure of the HTNV Gn ectodomain to 2.15-Å resolution (below). The schematic was produced with DOG (60) with the crystallized region of the Gn indicated by a bar colored as a rainbow. The signal peptide (SP), transmembrane domains (TM), the hydrophobic region preceding the WAASA cleavage site (TM′), intraviral domains (IV), and WAASA signal peptidase cleavage site are annotated. Putative N-linked glycosylation sequons are labeled above the schematic (pink pins). The structure is presented as a cartoon and colored as a rainbow ramped from blue (N terminus) to red (C terminus). Disordered regions comprising residues 190 to 197 and residues 281 to 289 are highlighted (dotted lines, green and orange, respectively). The crystallographically observed glycan at Asn134 is shown as pink sticks. (C) Structural comparison of HTNV Gn and PUUV Gn. Overlay of HTNV Gn and PUUV Gn, colored as a rainbow and in gray, respectively (ribbon representation), is shown on the left. At right is the HTNV Gn with root mean square (RMS) deviation of equivalent residues between PUUV Gn mapped onto the Cα trace. The tube radius and color represent the RMS deviation (ramped from blue to red). Regions with high deviations between PUUV Gn and HTNV Gn structures are thick and red. Regions with low deviations are thin and blue.

