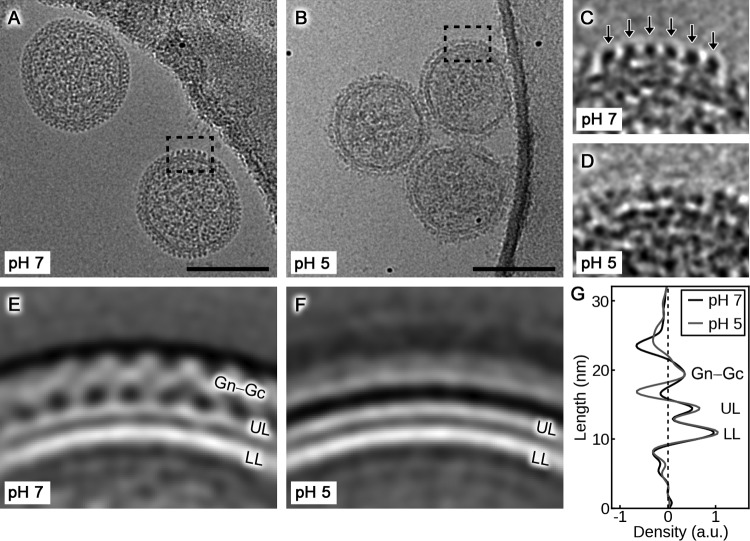
FIG 4.
Cryo-electron microscopy analysis reveals the metastability of the hantavirus envelope. (A and B) Representative cryo-electron micrographs of TULV after incubation at pH 7 and pH 5, respectively. Scale bar, 100 nm. (C and D) Close-ups of the areas indicated in panels A and B with the regular lattice of Gn-Gc spikes indicated with arrows in panel C. No regular lattice is visible in the virions incubated at pH 5. (E and F) Representative 2D class averages of the virion surface at pH 7 and pH 5. Density has been inverted so that white corresponds to the virion. (G) An averaged density profile of the images in panels E and F indicating the average distribution of density perpendicular to the membrane at pH 7 and pH 5. Densities corresponding to the lower membrane leaflet (LL), the upper membrane leaflet (UL), and Gn-Gc spikes are indicated. a.u., arbitrary units.

