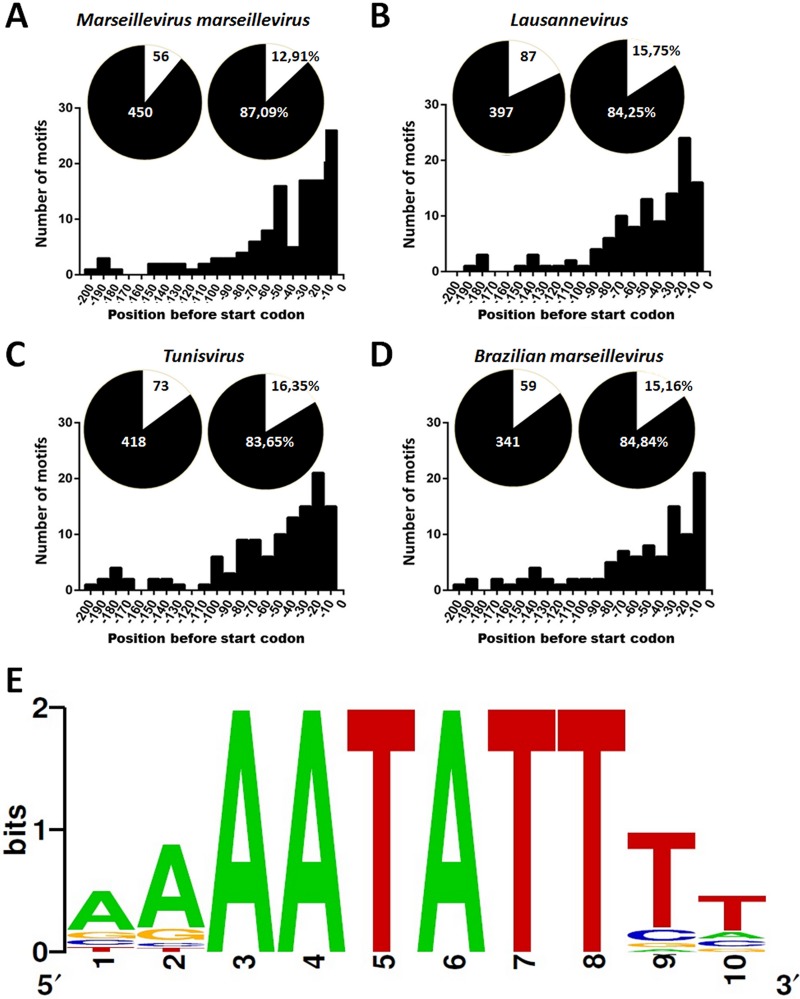
FIG 1.
AAATATTT motif in intergenic regions of marseilleviruses lineages. (A to D) The distribution of the AAATATTT motif in intergenic and coding regions is represented by a circle graphic with black and white colors, respectively. The bar graphs represent the distribution −200 bp upstream of the ATG start codon in all marseilleviruses lineages. (E) The promoter motif sequence logo that was generated using the Berkeley Logo platform.

