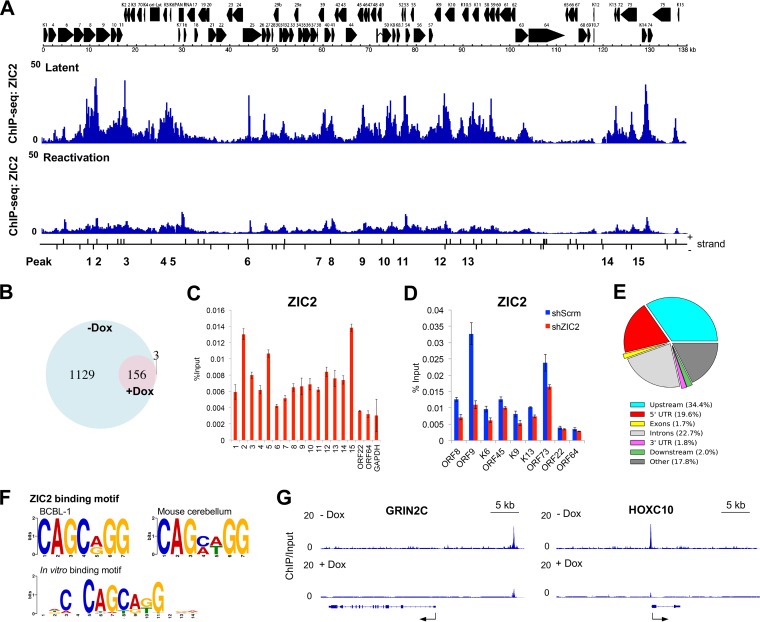
FIG 5.
Genome-wide distribution of ZIC2 on the latent KSHV genome. (A) ChIP-Seq analysis of ZIC2 binding to the latent KSHV genome and Dox-induced (1 μg/ml, 24 h) TREx-F3H3-K-Rta BCBL-1 cells. ChIP enrichment signals were normalized to those derived from the input DNA control. The positions of the predicted ZIC2 recognition motif [CAGC(A/G)GG] on the KSHV genome are also indicated. Short vertical lines denote the corresponding positions of the ZIC2 motif on the two DNA strands of the KSHV genome. (B) Venn diagram illustrating the overlap between ZIC2 peaks on the host genome from ChIP-Seq with latent and lytic reactivated BCBL-1 cells. (C) Verification of the ChIP-Seq result by ChIP-qPCR analysis of the indicated genes/regions in BCBL-1 cells. (D) Verification of the ChIP-Seq result by ChIP-qPCR analysis in ZIC2-KD cells. iSLK.219 cells were transduced with lentivirus expressing shScrm or shZIC2. ChIP-qPCR assays were performed to determine the level of ZIC2 binding on the indicated regions at 72 h postransduction. (E) Genome-wide distribution of ZIC2 in latent BCBL-1 cells. Genomic distribution of ZIC2 enrichment peaks throughout the human genome determined by ChIP-Seq analysis. The upstream and downstream lengths for annotation were set to 3 kb flanking the gene transcript start and termination sites. UTR, untranslated region. (F) Identification of a ZIC2 recognition motif. ZIC2-binding motifs were analyzed from ZIC2 ChIP-Seq data from latent BCBL-1 cells and data from a developing mouse cerebellum (GEO accession number GSM1486431) using the MEME suite of programs. The E value was <10−10. The in vitro mouse Zic2 protein binding motif from the JASPAR database (accession number PB0206.1) is also shown. (G) Genome browser tracks showing ZIC2 at the GRIN2C and HOXC10 genomic loci in latent and lytic reactivated BCBL-1 cells.

