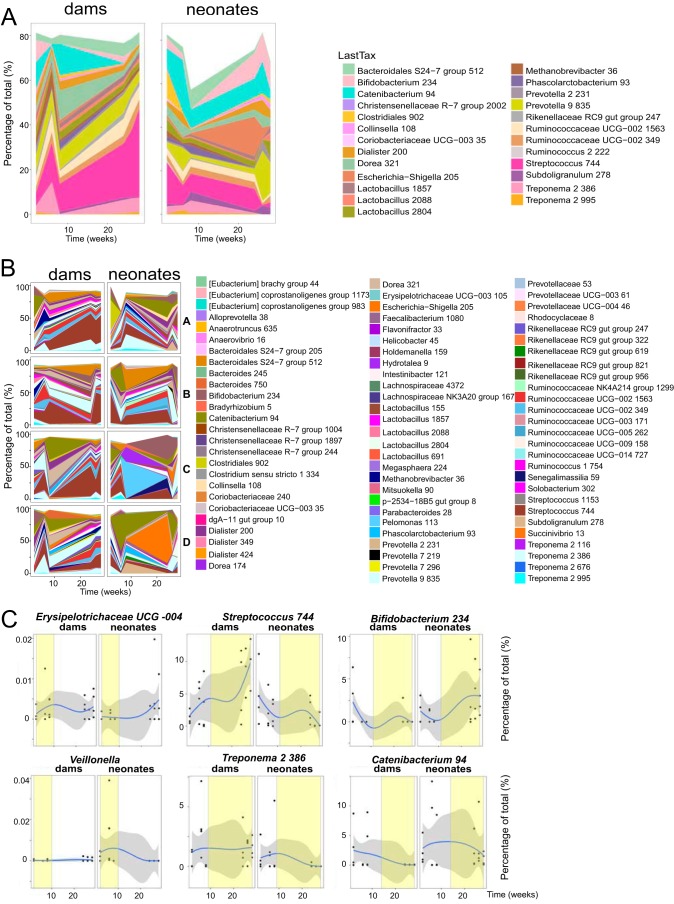
FIG 4.
Changes in the fecal microbial communities of neonatal RMs and dams over time. (A) Changes in the relative proportion of the 25 most abundant assigned taxa over time in neonatal RMs and dams as groups by 16S rRNA sequencing. The lowest meaningful taxonomic assignment (“LastTax”) is shown for each OTU. Taxa were agglomerated using single-linkage phylogenetic clustering at h (cutoff height of the hierarchically clustered phylogenetic tree where organisms with a cophenetic distance smaller than h are agglomerated into one taxon) of 0.2. (B) Relative proportions of the 80 most abundant assigned taxa over time in individual pairs of RM dams and neonates (pairs A to D) by 16S rRNA sequencing. (C) Representative taxon changes over time with windows of statistical differences (yellow) between dams and neonates, controlling for dam-neonate pairs and multiple intraindividual testing using smoothing spline ANOVA. The gray area indicates the confidence intervals, and the blue line indicates the mean percentage of each group. The x axis represents time, in weeks. Each dot represents one animal.

