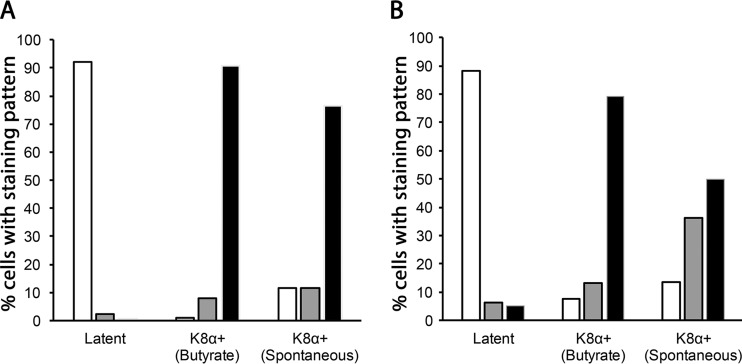
FIG 8.
Quantitation of K15P-HA and TGN46 staining patterns. (A) Fields of BCBL-1-HA cells were immunostained for HA and K8α. The numbers of cells displaying compact (white bars), intermediate (gray bars), and dispersed (black bars) patterns of HA immunoreactivity (see the text for more details) were counted and plotted as percentages of the total. Cell conditions are indicated below each set of bars, as follows: latent, untreated cells that were K8α negative (250 cells counted from 4 fields); K8α+ (butyrate), cells that were K8α positive following incubation with 1 mM sodium butyrate for 48 h (97 cells counted from 6 fields); and K8α+ (spontaneous), untreated cells that were K8α positive (17 cells counted from 13 fields). (B) Identical to panel A except that cells were stained and their morphology scored for TGN46. Cell numbers were as follows: latent, 214 cells counted from 17 fields; K8α+ (butyrate), 91 cells counted from 9 fields; and K8α+ (spontaneous), 22 cells counted from 18 fields. The small numbers of spontaneously occurring K8α-positive cells that were counted reflect the rare nature of the phenotype.

