
Fig. 3.
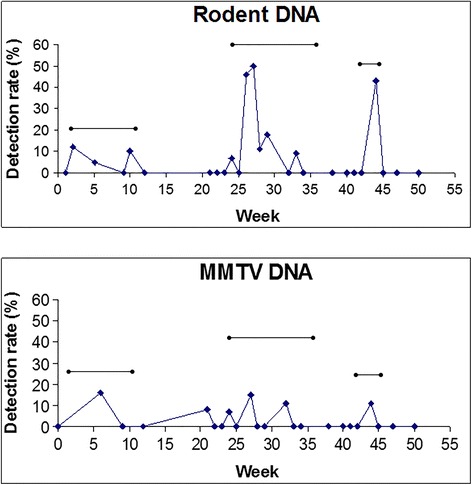
Detection rates of either rodent DNA or MMTV DNA at different time points over a year. The •──• lines indicate periods of time in which major construction projects took place in our building
Official websites use .gov
A
.gov website belongs to an official
government organization in the United States.
Secure .gov websites use HTTPS
A lock (
) or https:// means you've safely
connected to the .gov website. Share sensitive
information only on official, secure websites.
Detection rates of either rodent DNA or MMTV DNA at different time points over a year. The •──• lines indicate periods of time in which major construction projects took place in our building