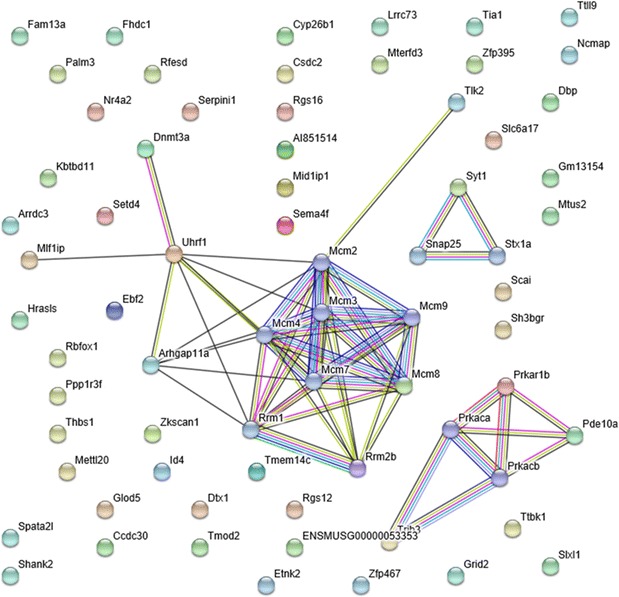
Fig. 7.

Protein network analysis by STRING software. The information about the restoration of gene expression by SRme administration in hyperlipidemic mice was uploaded into STRING software (version 9.1) for the analysis of the interactions of related proteins and protein–protein interactions. Network nodes represent proteins and edges represent protein–protein associations. Light blue colored edges mean known interactions imported from curated databases; purple, experimentally determined. Green colored edges mean predicted interactions between genes of neighborhood; red, gene fusions; dark blue, gene co-occurrence
