Fig. 3.

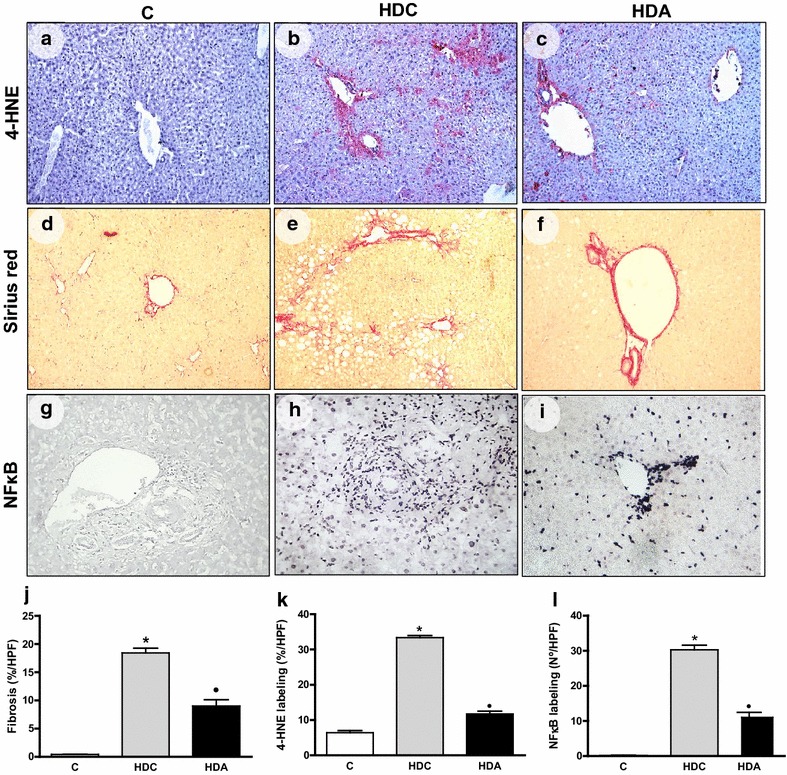
Representative photomicrographs of liver sections stained with 4-HNE (a–c), Sirius red (d–f) and NF-kB (g–i) staining in the liver in the control group (C); diabetic and high fat diet mice (HDC); diabetic and high fat diet mice treated with aliskiren (HDA) (× 400 magnification). Graphic representation of fibrosis (j), 4-HNE labeling (k) and NF-kB labeling (l) in C, HDC and HDA groups. *P < 0.05, C × HDC; ●P < 0.05, HDC × HDA. (n = 4–6 mice per group)
