
Fig. 9.
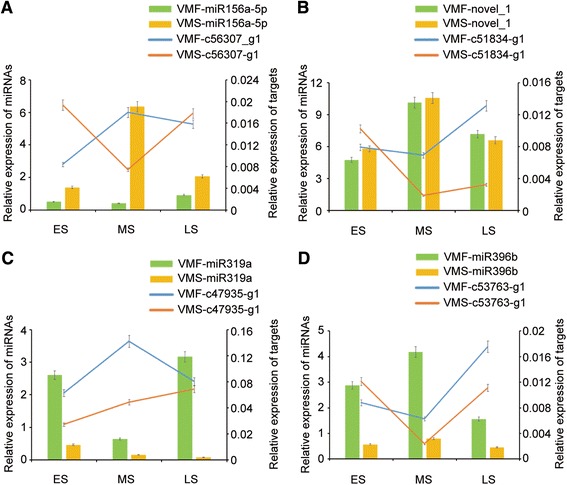
Correlations between miRNA and target gene expression. a-d The bars and lines indicate the expression levels of miRNAs and their corresponding targets, respectively, at the three different floral growth stages, as determined by qRT-PCR. The left and right y-axes represent the expression levels of the miRNAs and target genes, respectively. The error bars indicate the standard deviations