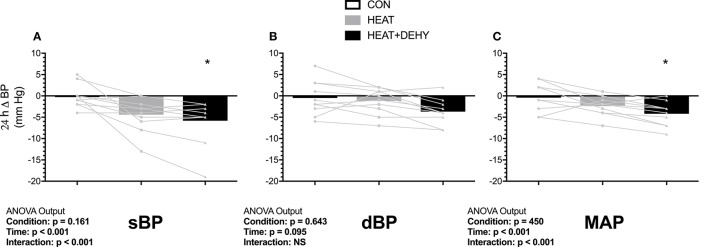
Figure 3.
The additive effects of heat stress and hydration status on the 24-h change in systolic (sBP, A), diastolic (dBP, B) and mean arterial blood pressure (MAP, C) after the 90-min exercise condition. Statistical significance (ANOVA Output) is illustrated. Data presented are group mean with individual values overlaid. *Denotes significantly different (p < 0.05) than CON.

